
Detailed vs Summary Tables: Why Not Both?

Imagine a scenario where your data source has hundreds of millions or even billions of rows. If you try to use this data in Tableau, it’s likely that you’ll run into some problems. One of the first problems you’re likely to encounter is that your database just isn’t powerful enough to query that much data quickly. You might have a powerful analytics database that can handle this, but often, you will not. If you try to create an extract of that data in Tableau, then that extract will probably time out before it’s completed, leading to the need to do an incremental extract refresh. And, once the data is extracted, Tableau is likely to struggle a bit with that amount of data.
Summary Tables
But do you really need that lowest
level of data granularity? Do you need to see every single transaction? If you’re
dealing with this volume of transactions, then it’s highly unlikely that you
need this level of detail. Thus, the typical solution for this problem is to
create a summary table within your data warehouse (or data lake, data mart, or
wherever you store this data).
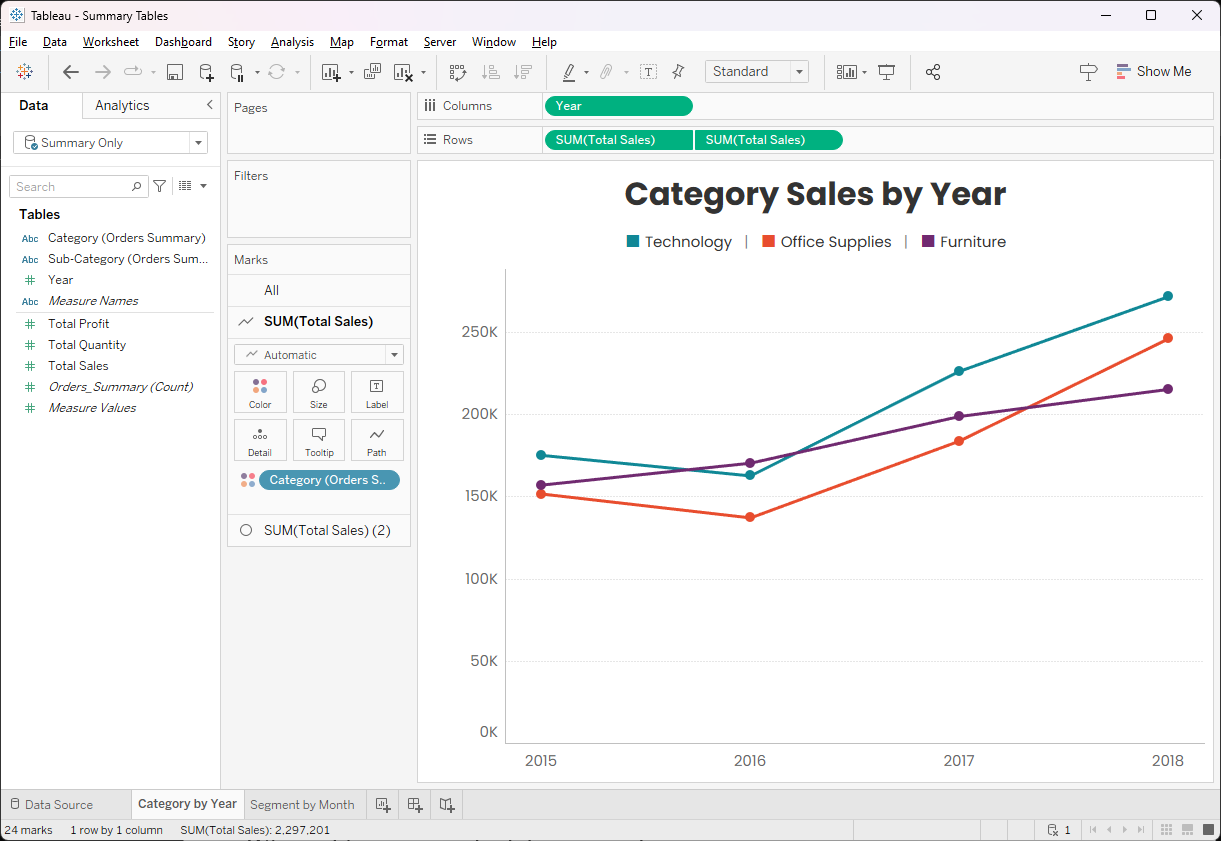
Let’s take Superstore’s Orders
table, for example. This table only has about 10,000 records, but let’s say it
had 1 billion. We might decide to create a summary table that aggregates the
data by Year, Category, and Sub-Category, summing up the
measures, Sales, Profit, and Quantity. The resulting
summary table will have orders of magnitude fewer records, making it easier to
work and much more performant.
This table will be aggregated to the
highest level of granularity needed to meet your analysis needs. Choosing the
level of granularity is a bit of a balancing act, however. You want to choose a
high enough level of granularity in order to guarantee there are significantly fewer
records, but you’ll want a low enough level of granularity to ensure that the
summary table can be used by multiple people and for multiple use cases.
Once we have this summary table (and
have set it up to be refreshed on some regular basis), we’ll use that table in
Tableau and we’ll get much better performance.
Creating a Summary Table
Let’s take a moment to create a
summary table using SQL. If you’re not interested in all the SQL, then feel
free to skip the bulk of this section. Just be sure to review the structure of
our summary table before moving on.
As mentioned above, we’d like to create
a table aggregating Sales, Profit, and Quantity by Year,
Category, and Sub-Category. We’ll create a table like this:
CREATE
TABLE Orders_Summary(
[Year] int,
[Category] nvarchar(100),
[Sub-Category] nvarchar(100),
[Total Sales] decimal(38, 2),
[Total Quantity] int,
[Total Profit] decimal(38, 2),
)
GO
We’ll then create a simple process
that refreshes this from the detailed table.
TRUNCATE
TABLE Orders_Summary
GO
INSERT
INTO Orders_Summary (
[Year]
,[Category]
,[Sub-Category]
,[Total Sales]
,[Total Quantity]
,[Total Profit]
)
SELECT
YEAR([Order Date])
,[Category]
,[Sub-Category]
,SUM([Sales])
,SUM([Quantity])
,SUM([Profit])
FROM
Orders
GROUP
BY
YEAR([Order Date])
,[Category]
,[Sub-Category]
We’d schedule this to run on a
regular basis—perhaps daily—so that we’re getting up-to-date data.
Note: We could, of course, also use
other tools, such as Tableau Prep, to create this summary table.
Finally, we connect this to Tableau and
create our super-performant charts!!
Use Both Summary & Detail
In the above example, there was so
much data that it doesn’t really make sense to ever show the detailed data. But,
if you had a smaller data set, then there might be some use cases where the detailed
data is of use. For example, let’s say you have 5 million rows that span over
the past 20 years. You may want to drill down on one specific month and one specific
customer—that might only be a few hundred rows.
Though we need the lowest level of
detail, most of our analysis will still be at a higher level. For these higher
level charts, we could try using the detailed data and letting Tableau do the
aggregation, but that’s still quite a bit of data and might not be as
performant as we like, especially if we have several filters or are using other
features of Tableau. So, what if we use the summary table for these charts and
only use the detailed data when we need it?
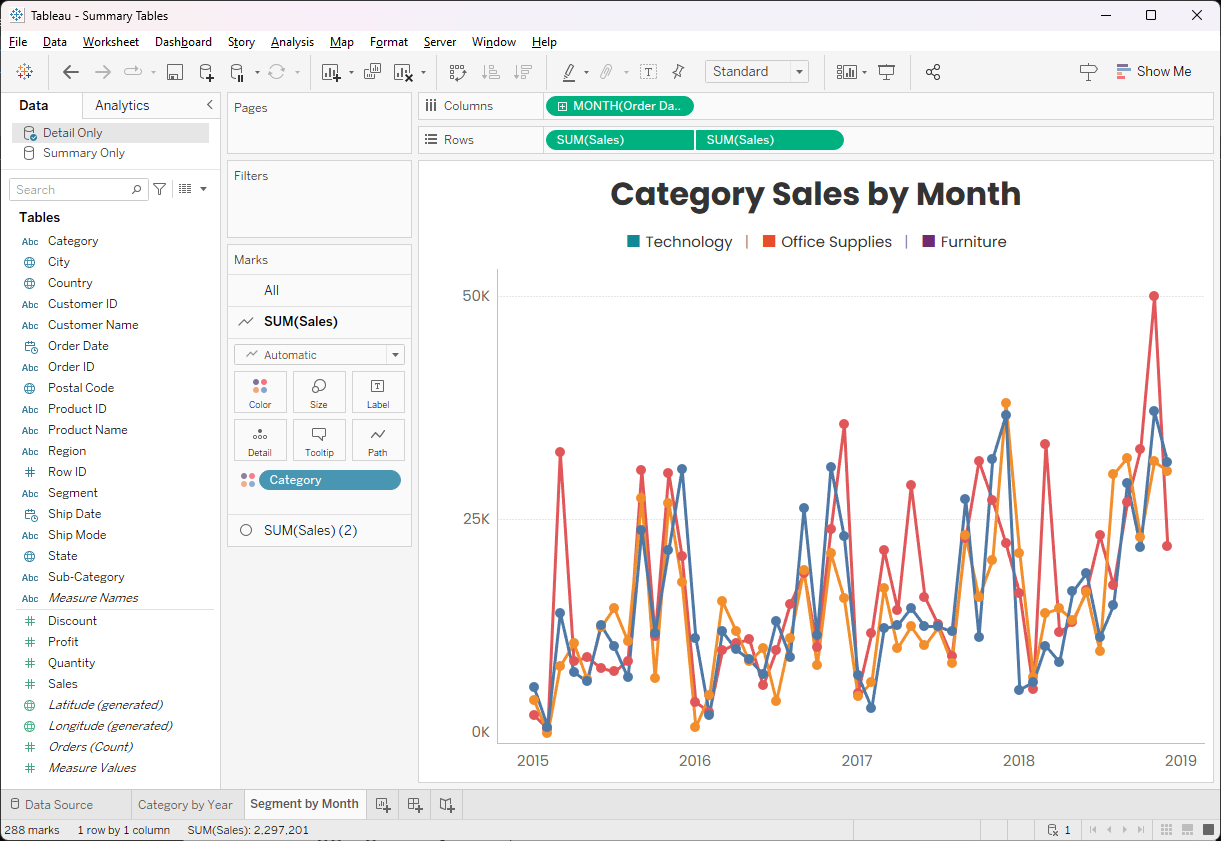
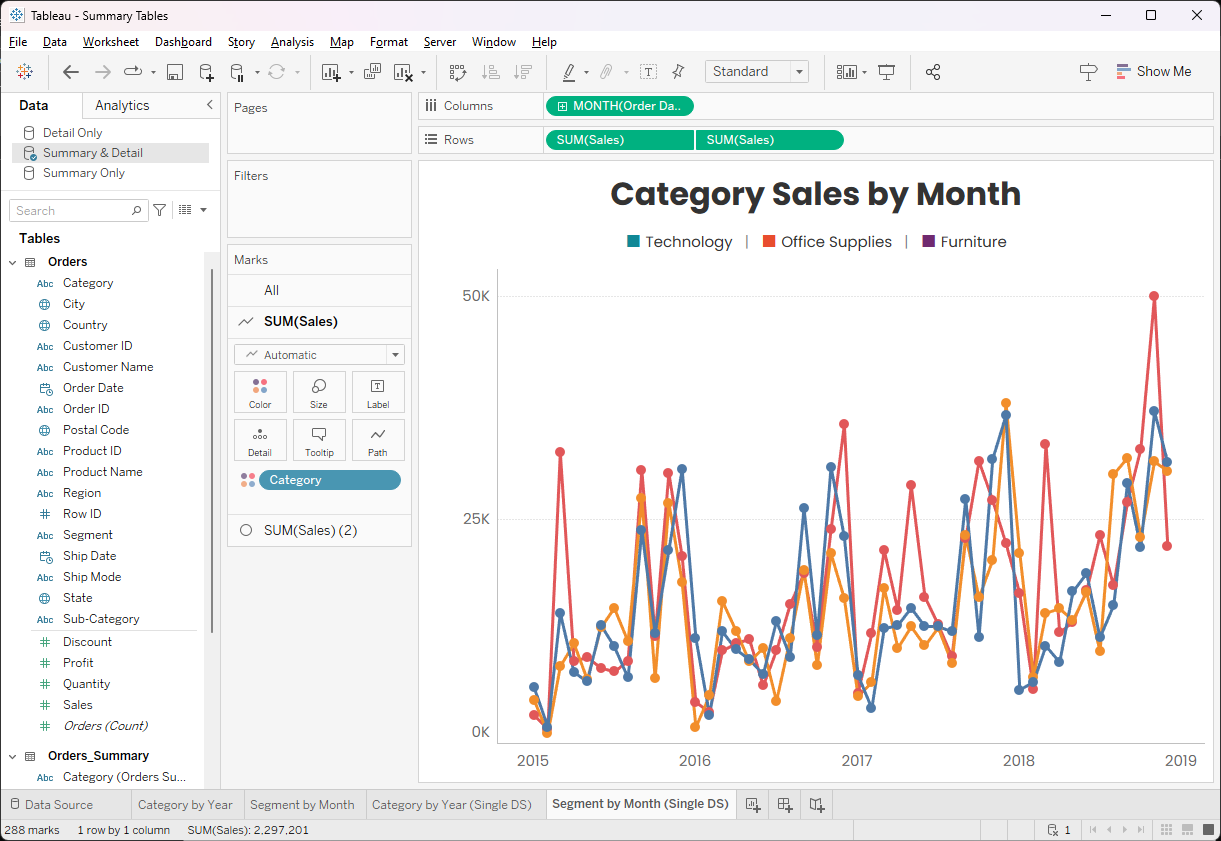
To do this, we’ll create a second
data source connecting to the detailed data. Using our example, we could create
a line chart by month (remember that our summary table aggregates by Year so we
can’t use that).
This works well, but there are a
couple of problems.
First, you now have two separate data
sources that you’ll need to maintain and keep in sync with each other. Calculated
fields, sets, groups, etc. may need to be created in both data sources. That is
a pain in the neck and, in many cases, simply isn’t worth the effort.
Second, and perhaps more problematic,
is that it will now be more difficult to filter across these data sources. In
the charts we’ve shared so far, for example, you might want to have a shared
filter on Year. While you might be able to get this to work, it would require
blending and I try to avoid that whenever possible.
So, do we just use the detailed data and
deal with the performance hit? I have another idea…
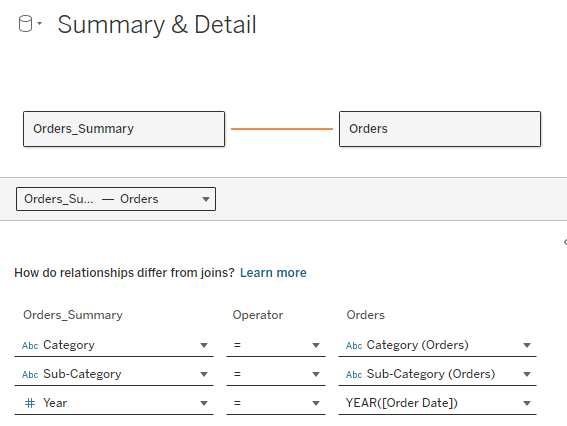
Both in a Single Data Source
Here’s a solution that allows us to
use both summary and detailed data in the same data source. We’ll create
a new data source and add both tables. We’ll then relate these tables on the dimensions
shared between them—in our example, Year, Category, and Sub-Category
(these are the fields that define the level of granularity of our summary table).
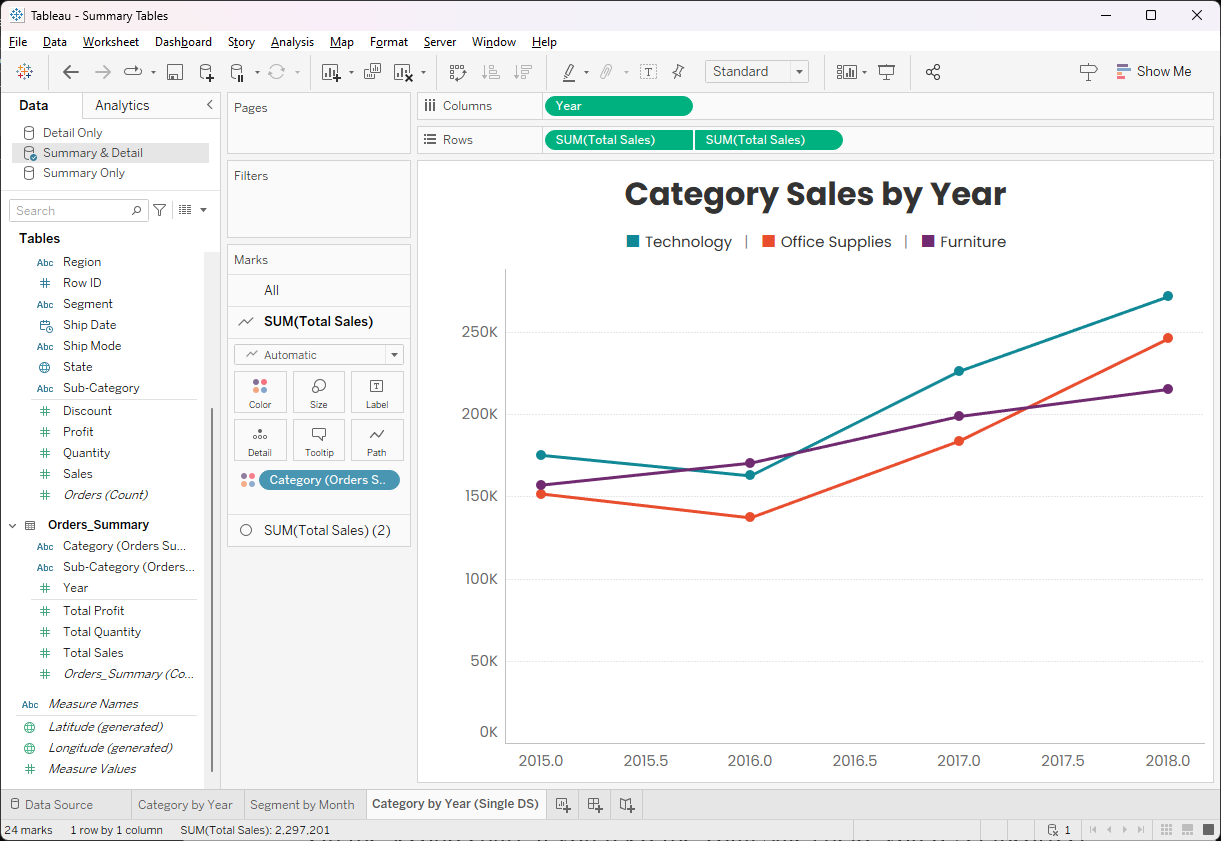
When we create a chart in Tableau
that is above the summary table level of granularity, then we’ll use the
fields from the summary table.
And, when we need the detailed
information, we’ll use the fields from the detail table.
At this point, you might be saying “No,
don’t do that!” If so, then your concern is likely that this data source is
joining the two tables and, therefore, it’s always selecting those millions of
records from the detail table, which defeats the purpose. But remember that this
is not how relationships work. The previous data model leveraged physical
joins, so that would have been the case several years ago, but relationships
only use a table when fields from that table are used on the view. Let’s
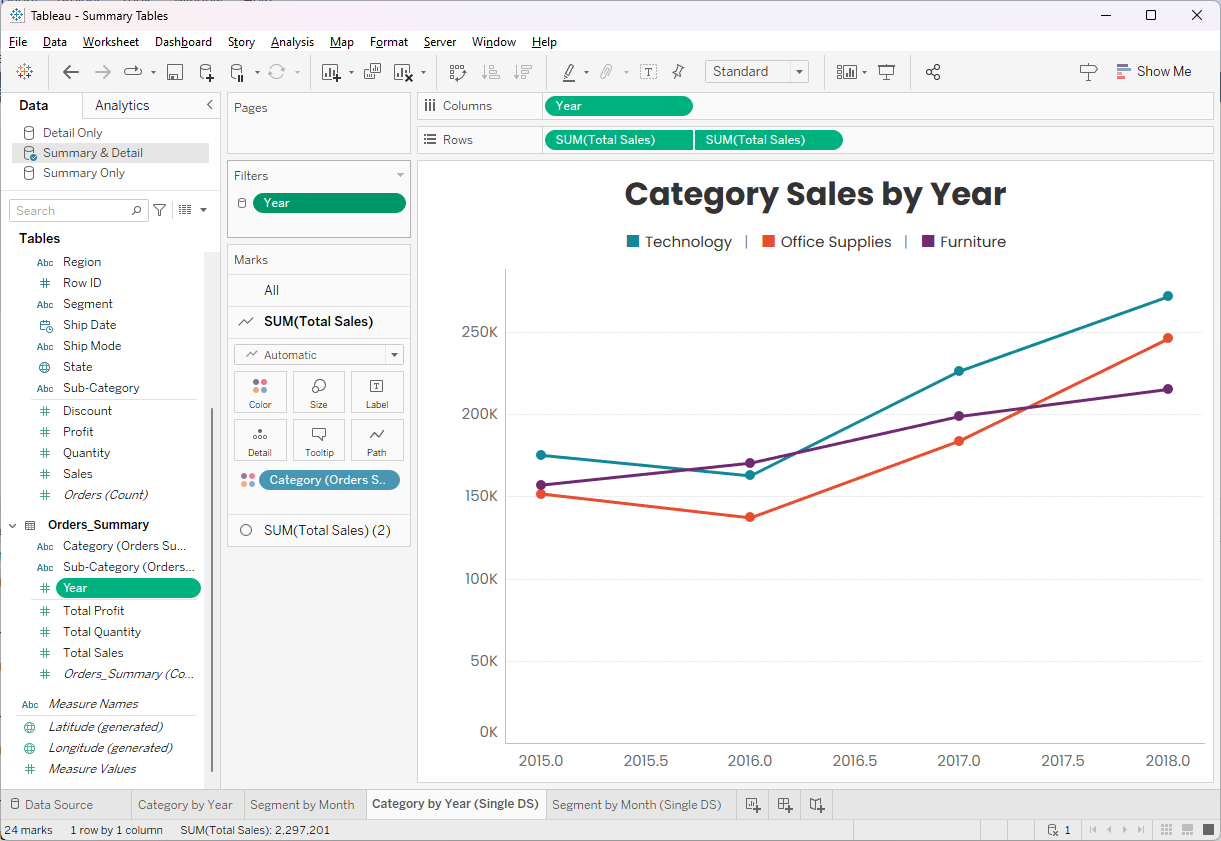
explore this further using the first example. That sheet used Year, Category,
and Total Sales—all of which come from the summary table. So, when
constructing the query to send to the database, Tableau realizes that it only
needs the Orders_Summary table and it “culls” the join to the detailed Orders
table. Here’s the SQL it runs (I’ve cleaned up the syntax a little for
clarity):
SELECT
[Category]
,[Year]
,SUM([Total Sales]) as [Total Sales]
FROM
Orders_Summary
GROUP
BY
[Category]
,[Year]
The Orders table is completely
ignored in this SQL. It’s only when we use a field from the detailed data that
the join will be added. And since this is only querying the summary table, we’ll
get the same great performance as the separate data source.
Note: For more on relationships and
how they work vs the previous data model, see Tableau's
New Data Model & Relationships.
But it also solves the two problems
we mentioned before. We only have a single data source to maintain.
Furthermore, this data source can handle many more use cases than either of the
separate ones could on their own.
And, more importantly, we can now use
filters across sheets. For example, let’s add a Year filter and apply it to all
sheets.
Because this field comes from the summary
table, the join to the detail table will still be culled, thereby maintaining
our performance. But we do need to be careful here. If we were to filter on a
field from the detail table, that would cause Tableau to add a join to the SQL
and that could have a huge impact on performance. So, when we apply filters
across sheets using a mix of summary and detailed data, we should only use
fields from the summary table.
Note: If you filter a detailed view
using a summary field, it will create a join, but since we’re already using the
detailed data, that join to a smaller table will have limited impact. It will
slow the query somewhat, but it should be negligible.
Wrap-Up
In my career, I haven’t had to work
with a lot of huge data sets. In those cases where I have, I’ve been fortunate
enough to have a powerful analytics database processing that data. But not
everyone is so lucky and the sheer volume of our data is increasing by the
minute.
Fortunately, summary tables can help
us to address some of these problems by significantly reducing the size of our
data. And, since most of our analysis will be done at that higher level, we can
often forgo use of the detailed data entirely. But, every now and then, you
will have a use case that requires that granular data. Fortunately, as we’ve
seen here, you don’t necessarily need to revert to using that detailed data for
everything. Instead, you can create a single data source that gives you the
best of both worlds! While this technique is not something you’ll use every
day, it’s a powerful one that could be a lifesaver.
Thanks for reading. Feel free to
leave your thoughts in the comments below.
Ken Flerlage, August 5, 2024
Twitter | LinkedIn | GitHub | Tableau Public


Love the detailed summary tables here! They are visually appealing and concise, making it easier to digest the data. Fantastic work in balancing detail with readability.
ReplyDelete