
Kirk Munroe: New in Tableau 2024.2 – Shared Dimensions

Kevin and I
are pleased to welcome back Kirk Munroe for another guest post. Kirk lives in
Halifax, Nova Scotia, Canada and is a business analytics and performance
management expert. He is currently one of the owners and principal consultants
at Paint with Data, a visual analytics consulting firm, along with his
business partner and wife, Candice Munroe, a Tableau User Group Ambassador and
former board member for Viz for Social Good.
Kirk is also the author of Data Modeling with Tableau, an extensive guide, complete with step-by-step explanations of essential concepts, practical examples, and hands-on exercises. The book details the role that Tableau Prep Builder and Tableau Desktop each play in data modeling. It also explores the components of Tableau Server and Cloud that make data modeling more robust, secure, and performant.
Shared Dimensions
At
Tableau Conference this year, I had the honour of presenting “Shared
Dimensions” with Thomas Nhan, the lead product manager for many of Tableau’s
data model capabilities. This might be the most significant business
intelligence feature since Tableau’s initial release in 2005. Not just for
Tableau, but for the entire BI industry. Yes, I know this sounds like
hyperbole, but hang with me and see if I can convince you.
We
called the session, “Multi-fact analysis using Shared Dimensions”. Multi-fact
analysis is just one use-case that shared dimensions enables. In fact, “shared
dimensions” is selling the feature short. It is really “sharing relationships
between multiple logical tables”, but that doesn’t really roll off the tongue.
We could simply think of this new feature as “Relationships v2.0.” (Composable
data sources were also announced at Tableau Conference as coming later this
year. That feature will allow us to create relationships from our tables to
published data sources for the first time. I would think of that feature as
Relationships 2.1, as it needed shared dimensions to happen first.)
History
Before
diving into shared dimensions, let’s take a quick look at the history of data
modeling in Tableau. Before the 2020.2 release, your only Tableau Desktop data
modeling options were connecting to a single table or creating a data model by physically
joining tables together. The sample data that comes with Tableau is, of course,
Superstore and it came as a single logical table until recently when
relationships to returns and people have been added.
In a real-world scenario, it could be possible to have a data engineering team
create a large, single table or view to allow for analysis in Tableau. If there
was no data engineering team involved, the data model would more likely look
something like this:
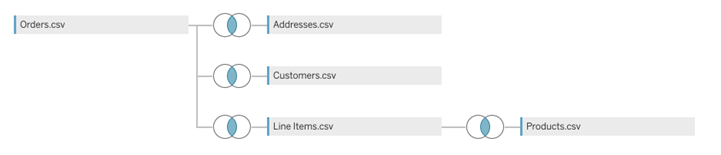
This
data model is very limiting. It both “explodes” the data and limits
the questions you can ask from the data.
Explodes the Data
What
do I mean by explode the data? First, the way to think about the amount of data
Tableau can handle isn’t “how many rows can Tableau handle?” It really is a
function of the number of rows AND columns (and the size of those columns!).
For simplicity, let’s treat all columns the same and think of it like a large
Excel sheet and count the cells.
In
this case, we have 5 tables:
Orders:
6 columns x 5,009 rows = 30,054 cells
Line
Items: 7 x 9,994 = 69,958
Addresses:
6 x 632 = 3,792
Customers:
4 x 795 = 3,180
Products:
4 x 1,882 = 7,528
When
we (inner) join these tables together, our cell count can be determined by
adding up the columns of all the tables and multiplying by the number of rows
of our longest table. In this case, we get 27 x 9,994 = 269,838 cells. Imagine
if the order and line item tables were from a business like Amazon or Shopify
where they process millions or billions of transactions a day!!
Note: There are cases where your data doesn’t
explode—sometimes on live connections and on extracts when you use the
“physical tables” setting. In any case, the query results are going to behave
like it is a single table, so the thinking holds even if it isn’t literal in
terms of disk space.
Limited Questions
What
about limited answers to questions? These inner joins filter data where there
are no matches, so relevant questions like “which products have we not sold?”
can’t be answered because those products have been filtered out of the data.
We
could address this by making all the joins outer joins except this leads to
even bigger issues. The data might end up being somewhere between as long as
the addition of the columns plus the addition of the rows multiplied together
and the number from our inner joins. In this case, it means we would end up
with somewhere between 269,838 and 494,424 cells depending on matches. The more
important issue is that you will end up with a lot of NULLS in your data which
can lead to both performance issues and potentially giving people the wrong
answers during analysis.
But,
Relationships
completely changed this game…
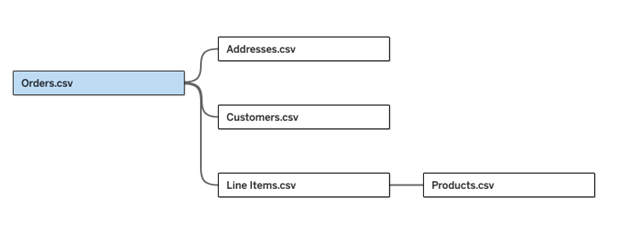
Each
table is stored independently, and the queries are composed at run time on a
sheet-by-sheet basis in Tableau. This means Tableau leaves each table as is
and can answer any question because the joins aren’t created in advance!!
This
results in only 114,512 cells and all the answers!
Shared Dimensions
With
that history behind us, how could the new shared dimensions feature be the
biggest feature introduced to the analytics/BI market in almost 20 years?
Relationships
help prevent data explosion and answer all questions in the same business
domain. What they don’t solve is analyzing data across different business
domains. Continuing with our Superstore example, imagine that we wanted to
understand the relationship between support cases and orders. The support cases
table might look like this:
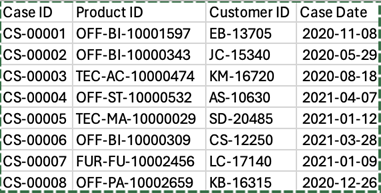
How
can we add this table to our model. We could create a relationship between it
and customers, but then how could we analyze support cases by product? What
about comparing order dates and the dates support cases are logged?
What we really want to do is create a
relationship between support cases and customers and products and dates.
Imagine the value we can bring to the business if we can show the relationships
(see what I did there?) between support cases and sales over time and by
customer and product!
To
provide cross-domain information today, you need to use different data sources
and either allow for visual comparison, drill-through from one workbook to
another using filter actions or get it with blends (but then only at a single
level of aggregation). My theory is that dashboards are often under-used is
because they either answer questions people already know, or they provide
cross-domain information but with no correlation between them (think of the
classic dashboard with loads of KPIs and spark lines).
So
how is this feature different and how does it enable cross-domain analyses?
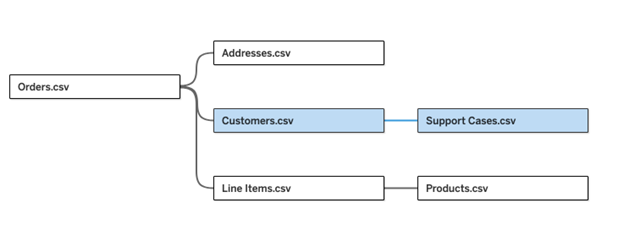
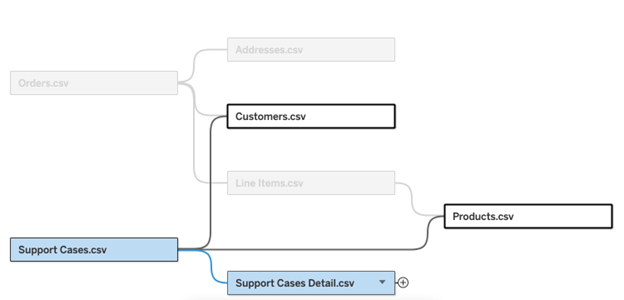
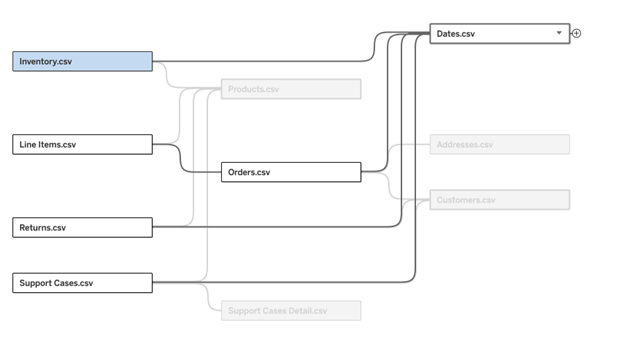
Shared
dimensions introduces the concept of “base tables”. This allows us to take our
support cases table and place it at the same level as our orders table. Then,
we can create relationships to any other logical non-base table, regardless of
how many other tables it relates to already! Also, you will notice that we
don’t have to connect every base table with the same tables downstream. This
allows us to create relationships to single tables, multiple tables, or all the
tables. And… when we hover on any table, it will highlight the tables it has
relationships with and grey out the ones it doesn’t.
We
can now answer some deeper questions and identify correlations which weren’t
possible before. Imagine answering the question, “what % of sales generate the
most support calls by subsegment?” and the follow-up question, “how does it
break down by sentiment?”
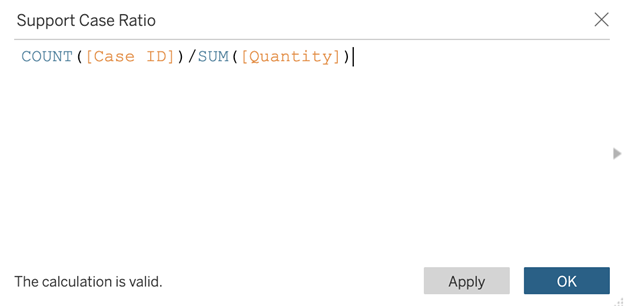
We
can now answer these questions. We can get order volume from the Line Items
table and number of cases from the Support Cases and join them in a
calculation:
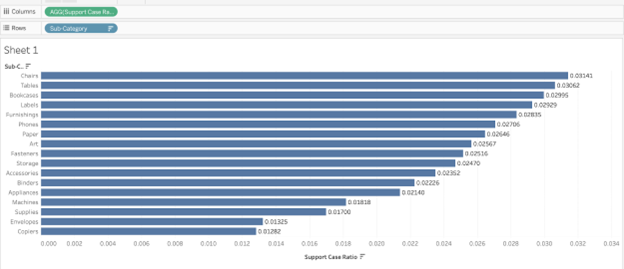
If
we bring this into the view and break it down by Sub-category, we can get the
products that generate the most support cases—weighted by sales! Tableau can
generate this query at runtime because both tables have relationships to the
Product Line table.
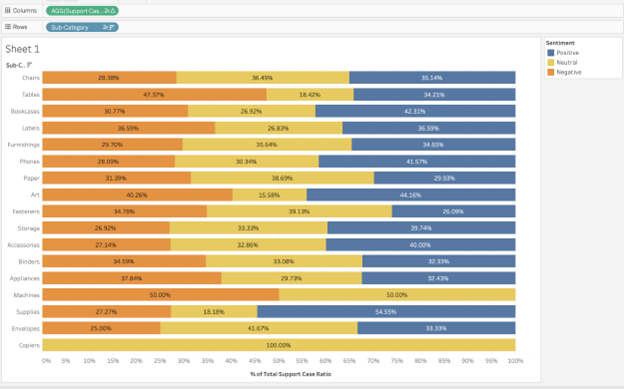
We
can go a step further and add sentiment to the view—even though sentiment is
not connected directly to products.
Date Dimensions
If
we continue to build out the data model by adding additional base tables,
creating relationships with our dimension tables, and joining all the base
tables to a common date dimension,
the questions we can to answer go even deeper.
Now,
with everything aligned to a single date field, we can also do trending across
the data in all tables with date dimensions, broken down by dimensions in any
of the shared tables. In this example, imagine being able to see the inventory
vs sales volume, by month, comparing tables to all other categories.
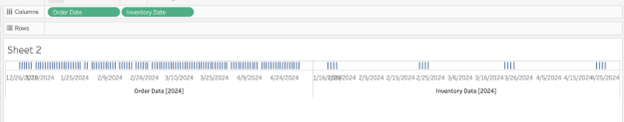
First,
we can see that inventory is not captured every day and sales occur many times
a day.
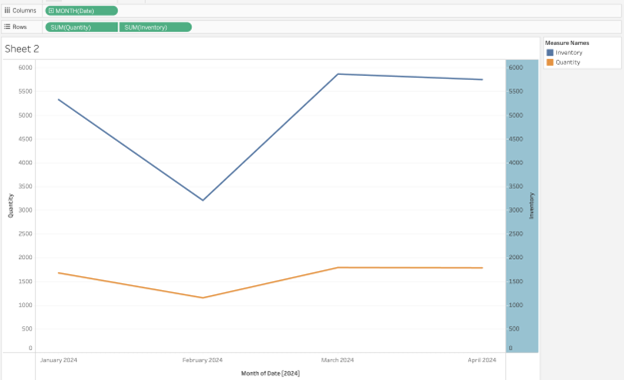
If
we align them by the common date from the Date table, at the level of month, we
can compare inventory levels to sales.
We
could continue with this and bring in other measures like support cases and
returns. We could further then break it down by dimensions in any other related
tables.
The
other possibility that it opens is bringing in measures that are not related to
anything except date. You’ve maybe thought, “I wonder if weather has an impact
on sales?” Now that is easy. If we brought in a weather table, we could see if
it has an impact on any other measure. Who knows, maybe support calls go up
when it rains!
Faster Analysis
Shared
Dimensions shortens the time to insights dramatically because the applications
that drive our analyses are made up of many tables. Traditionally, data
engineering teams had to take these many tables and combine them into a smaller
number of tables to be analysis-ready through a process called denormalization.
This is a time-consuming process that often had to occur before we could even
start using Tableau. Now you can—if your data is clean—take a snapshot of your
application tables and model them “as is” in Tableau!
Recap
Shared
Dimensions allows us to analyze data, using a single data source, in ways that
we’ve never imagined before—all at a much faster pace. This feature will fundamentally
change the way we think about our Tableau data sources.
By
the time you read this post, the feature should be live or in the process of
rolling out, so check it out!!
Thanks
for reading! If you have any questions or comments, please leave them in the comments
section below.
Kirk Munroe, June 24, 2024


As a BI manager with extensive history using PowerBI and Tableau, I cannot express how excited I am that tableau will now support true modeling capabilities(snowflake schemas etc).
ReplyDeleteKirk, I have an upcoming project that is a great candidate to test these features. Do you know of any way I can acquire a beta version of 2024.2? This would save me a significant amount of work on this project that will have multiple fact and dimension tables.
Hello e0gann - it is the released version of Tableau Cloud 2024.2 right now - so you don't need a beta! New Desktop and Server downloads usually follow within a week or two.
DeleteIf you don't have Tableau Cloud, and want to try right away, you can signup for a free 14-day trial at tableau.com.
I will post here when a see a new version of Desktop.
Amazing blog post! Thank you for breaking it down so well! Definitely looking forwards to this big game changer!
ReplyDeleteThank you - it is very exciting!
DeleteI think there's a funny type, making what was meant to be a compositable data source compostable (New eco-friendly data sources coming? :D)
ReplyDeleteHa - it is actually neither - I meant "composable" as in... "inter-relationships of components". Will make sure it gets up. Personally, I would have called this upcoming feature "extensible datasources" because you will be able to take a published data source and extend it to include new tables, calculations, etc.
DeleteFixed!
DeleteGreat post Kirk....though I do question the hyperbole of it being a big step forward for the BI industry considering that rivals have had this capability for some time now.
ReplyDeleteStill, I do celebrate that this feature is finally available - it's been long overdue!
Hi Darragh... we are living in the world of hyperbole! I should probably write a post or have a video on why I think it is this big of a step. It isn't the new semantic layer per se but what it enables through VizQL.
DeleteThese models were available even in Cognos (Framework Manager) and Business Objects (Universe) 20 years ago. The difference is Tableau's ability to combine what other products needed 3+ products to achieve (query vs analysis vs reporting/dashboarding). I still argue that PBI isn't really a (visual) analysis product (of course you can present the results of an analysis in it). Tableau's ability to go from query - analysis - dashboards in a single flow being the difference. Before this new extension to the data model, it was very difficult to do it outside one area of the business though! (This of different dashboard accelerators for Sales Cloud vs Service Cloud). Now we can get cross-business data in the same model (finally)!
Hi Kirk,
ReplyDeleteDoes this then mean that we will be able to join (or create a relationship) between two Published Data Sources?
Right now can only be done vía Blended Relationships
Thanks a lot!
Hello - sorry for the long delay. The plan for the next release (2024.3) is "composable data sources" which is the ability to create relationships (you won't be able to create joins to the best of my knowledge) with existing data sources. You are correct that blends is the only way to do it today.
DeleteGreat post and I learned a lot. I also download Kirk's book and read most part of it. Awesome book as well
ReplyDelete