
Use a Table Calc to Calculate the Slope of a Trendline

I was recently building a dashboard for a client and one data set was particularly challenging. The data looked at rates from 0 to 100% (exactly what it was measuring isn't important). Each row in the data showed a rate for a given product category on a weekly basis for an entire year. So one product category would have 52 rows associated with it - a rate for each week. If there were 10 product categories, there would have been 520 rows of data.
We were asked to show trends in the data. This could be done by calculating trends of month-over-month, quarter-over-quarter, or year-over-year. But that, unfortunately, would be a difficult task based on the structure of the data. Remember, this data showed the rate by week by product line. If we wanted to measure the month-over-month change, that would require aggregating those weekly rates up to a month (so essentially 4 weeks of rates). Well since it's a rate, we can't just aggregate them - you know the whole problem with averaging averages, right?
The problem is that we don't know the number of units. So let's say that you have two Calculus classes at a university. Each class gave their students a test consisting of 100 questions. Class A averaged 80 correct and Class B averaged 90 correct. One might say that the average score across both classes was 85. Well, that's not correct. The reason is that we don't know how many students were in each class. Let's say that Class A had 100 students and Class B had 10 students - would you still think the overall average was 85? No, it would be much closer to the 80 than it would the 90 because more students were in the class that averaged 80. To properly calculate this, you'd need to take a weighted average based on the number of students - 80*100 + 90*10 divided by the total number of students (110). The result is approximately 81%, not 85%.
So in my use, we had rates, but we did not have units (people, widgets, whatever). So if we just had raw rates by product category by week (without units), we would be unable to aggregate weeks up to months, quarters, years, etc. Similarly, we couldn't group up similar product categories for the same reason. So unless we can get information about the number of units (which we could not), we would be unable to utilize any type of aggregations in the data.
My initial thought was to simply show a trend line. But I really wanted to implement some preattentive attributes, like color, to make it very clear very quickly to the end user. I mean, this is what data visualization is all about - making data easier to see and understand. If I hovered over the trendline in Tableau, I could see the slope of the line, but it would be really nice if I could calculate the slope of that line in Tableau and then utilize that calculation to color the line accordingly. To keep it simple, I'd use blue for an increasing slope (a good thing) and red for a decreasing slope (a bad thing). Well, thanks to Jonathan Drummey, I discovered that you can, in fact, do this.
Before we write this calculation and utilize it in Tableau, let's take a look at the sample data set that I had ChatGPT create for me. This data set shows 9 product lines with a rate for each of 52 weeks in a year. Here is a sample:

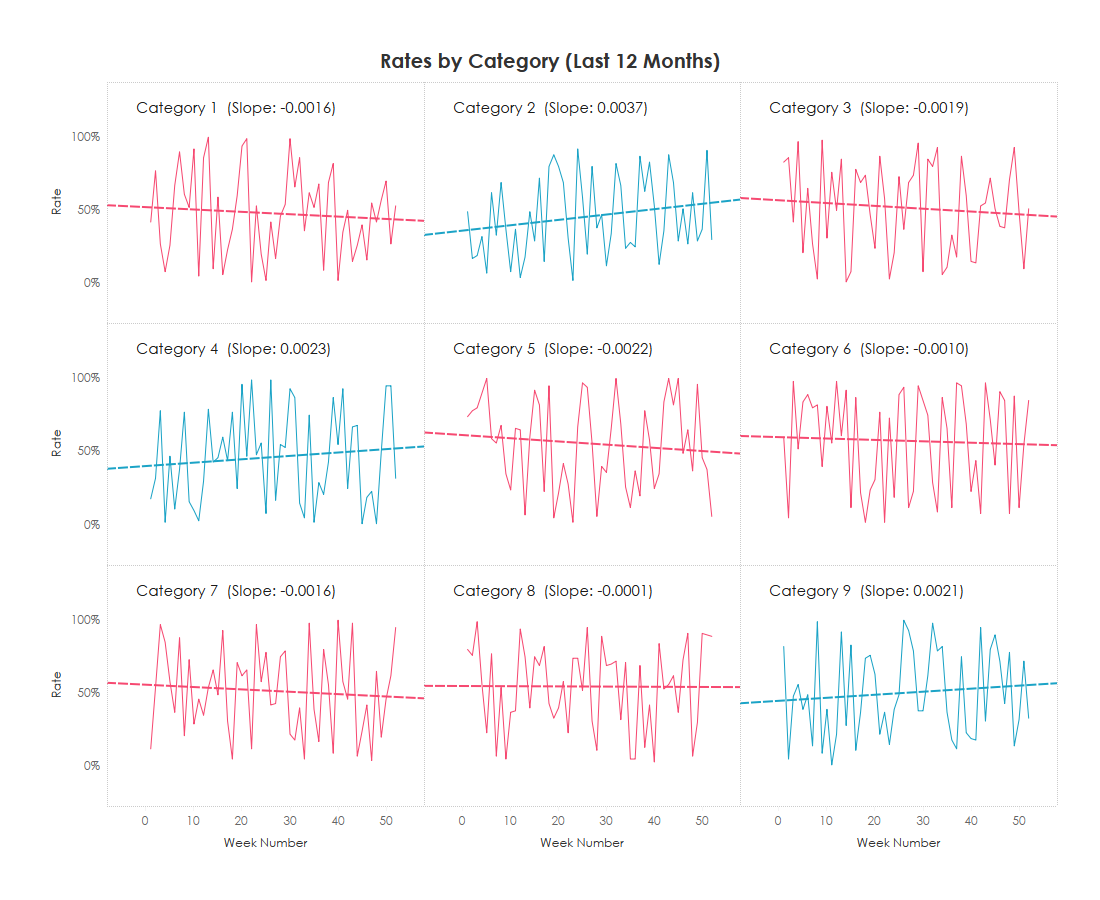
I connected to it in Tableau then built a small multiples chart to show all 9 product lines on the same scale. Below is a snapshot. (Check out the Tableau Public Workbook here if you want to follow along).
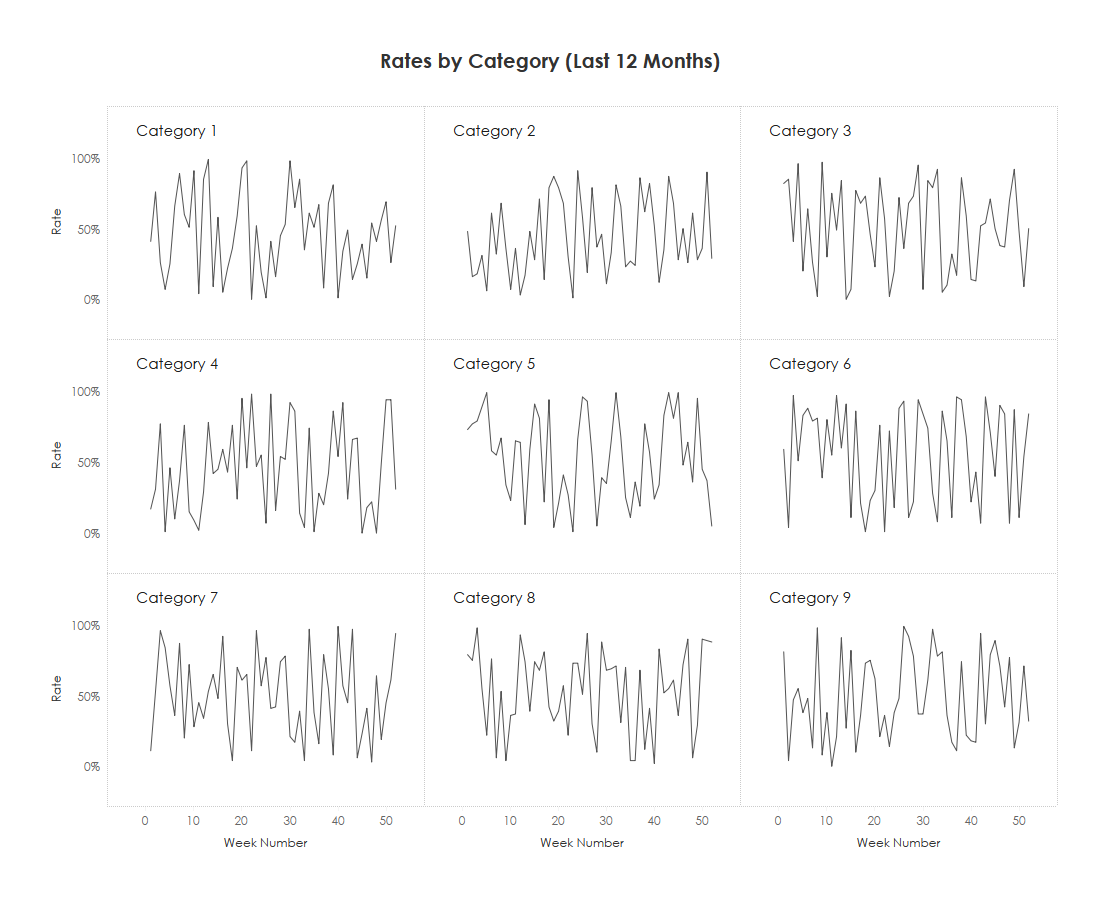
As you can see, with some volatility in the numbers, it is very difficult to see any sort of trends in this form. Can you tell if Category 1 is trending upward or downward? I cannot. So I added trendlines.

This helps a ton. We can now see the trends.
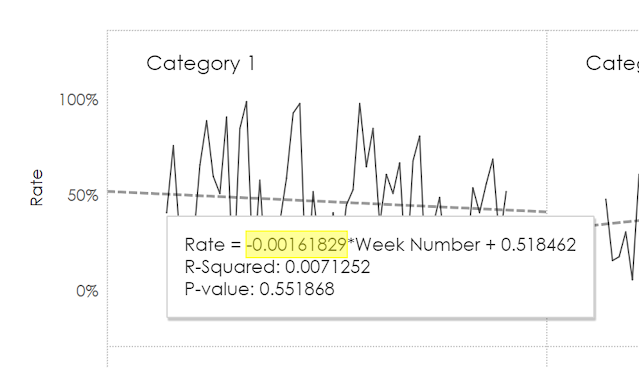
Now as you can see in the image below, when I hover over one of the trend lines, it provides me with a tooltip. The Rate = is just the formula for the line and is represented as y (rate) = mx + b where m is the slope. In this case, the slope is -0.00161829 (highlighted in the image). This is a negative number, which means that over time, the rates of this product category are trending downward. A positive number would represent an upward trend.
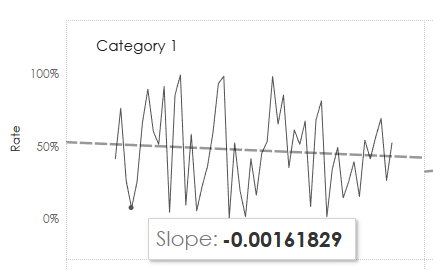
Yay! It matches exactly!
From here, I simply created a calculation of SIGN(Slope) - Sign will yield a -1 for all negative numbers, a positive 1 for all positive numbers, and a 0 for zeros. I then placed this calculation on color resulting in the following.
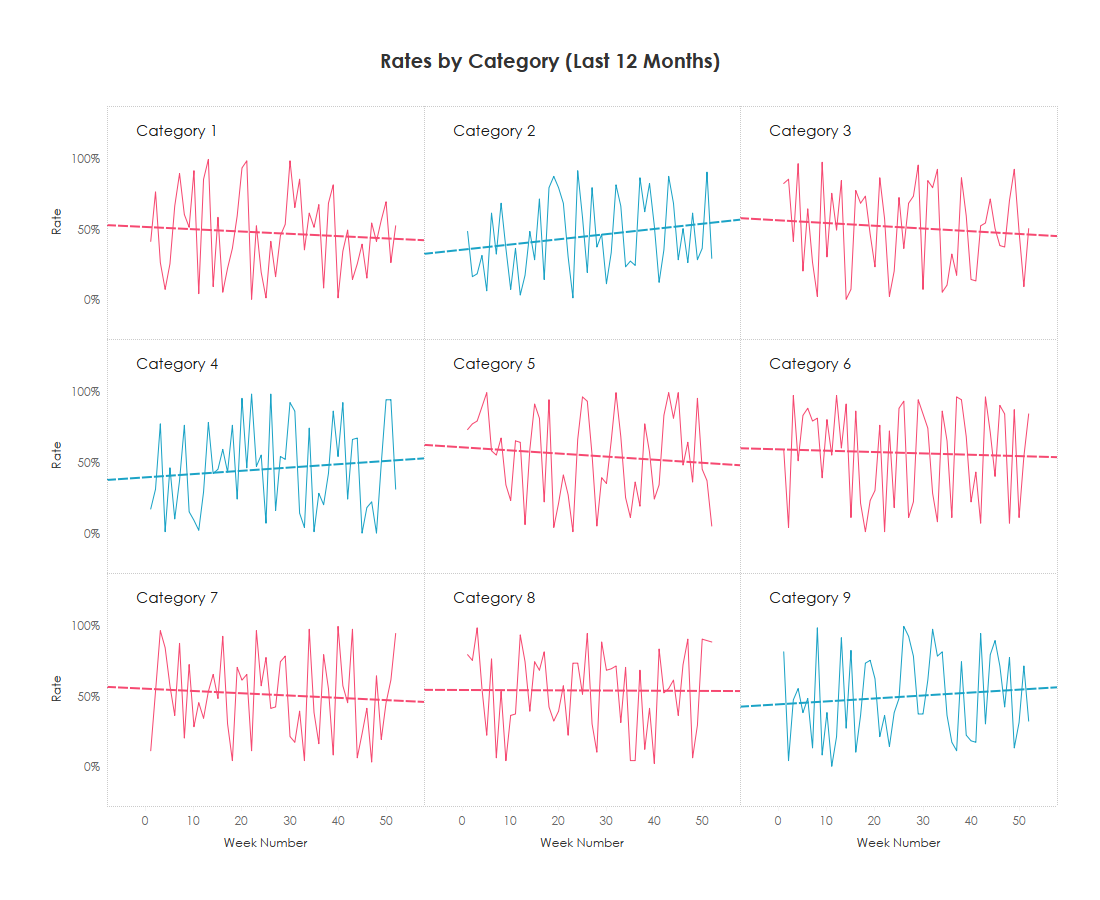
Now we can clearly see in an instant which categories are trending upward and which are trending downward.
And if you prefer to not just make it binary (up or down), you could use a diverging color scale (centered at zero) to show the degrees of your trend:

This is not only handy for highlighting the lines, but you could use it for a number of things including simply displaying it in the view.
I hope you found this blog post interesting. It might not be something you run up against regularly, but when you do, you have the tool in your toolbelt to solve it. Before I go, I want to give a huge shoutout to Jonathan Drummey. Jonathan has been giving tirelessly to our community for longer than just about anybody. Thank you, Jonathan, for all you do and have done for all of us!
Thanks for reading!


You are also able to utilize Tableaus regression model functions to calculate the slope. Jonathans answer is specifically about recreating the Excel value, but with the regression models, you can get the same result with Table calculations!
ReplyDeleteExample for a plot from the superstore data set with SUM(Sales) on Columns, SUM(Profit) on Rows, Sub-Category on detail:
//Slope
(MODEL_QUANTILE(0.5, SUM([Profit]), SUM([Sales])) - LOOKUP( MODEL_QUANTILE(0.5, SUM([Profit]), SUM([Sales])), -1))
/
(SUM([Sales])-LOOKUP(SUM([Sales]),-1))
Calculated along Sub-Category. MODEL_ functions have the additional benefit of being able to calculate arbitrary trend lines, so they are really neat!
https://www.phdata.io/blog/tableau-regression-models/
Great note!!! Thank you.
Delete