Single Sheet Trellis Chart Zoom
I recently created a visualization looking at Job Openings in the US. This data is public data from BLS.gov and the final workbook is available for viewing here on our company Tableau Public page.
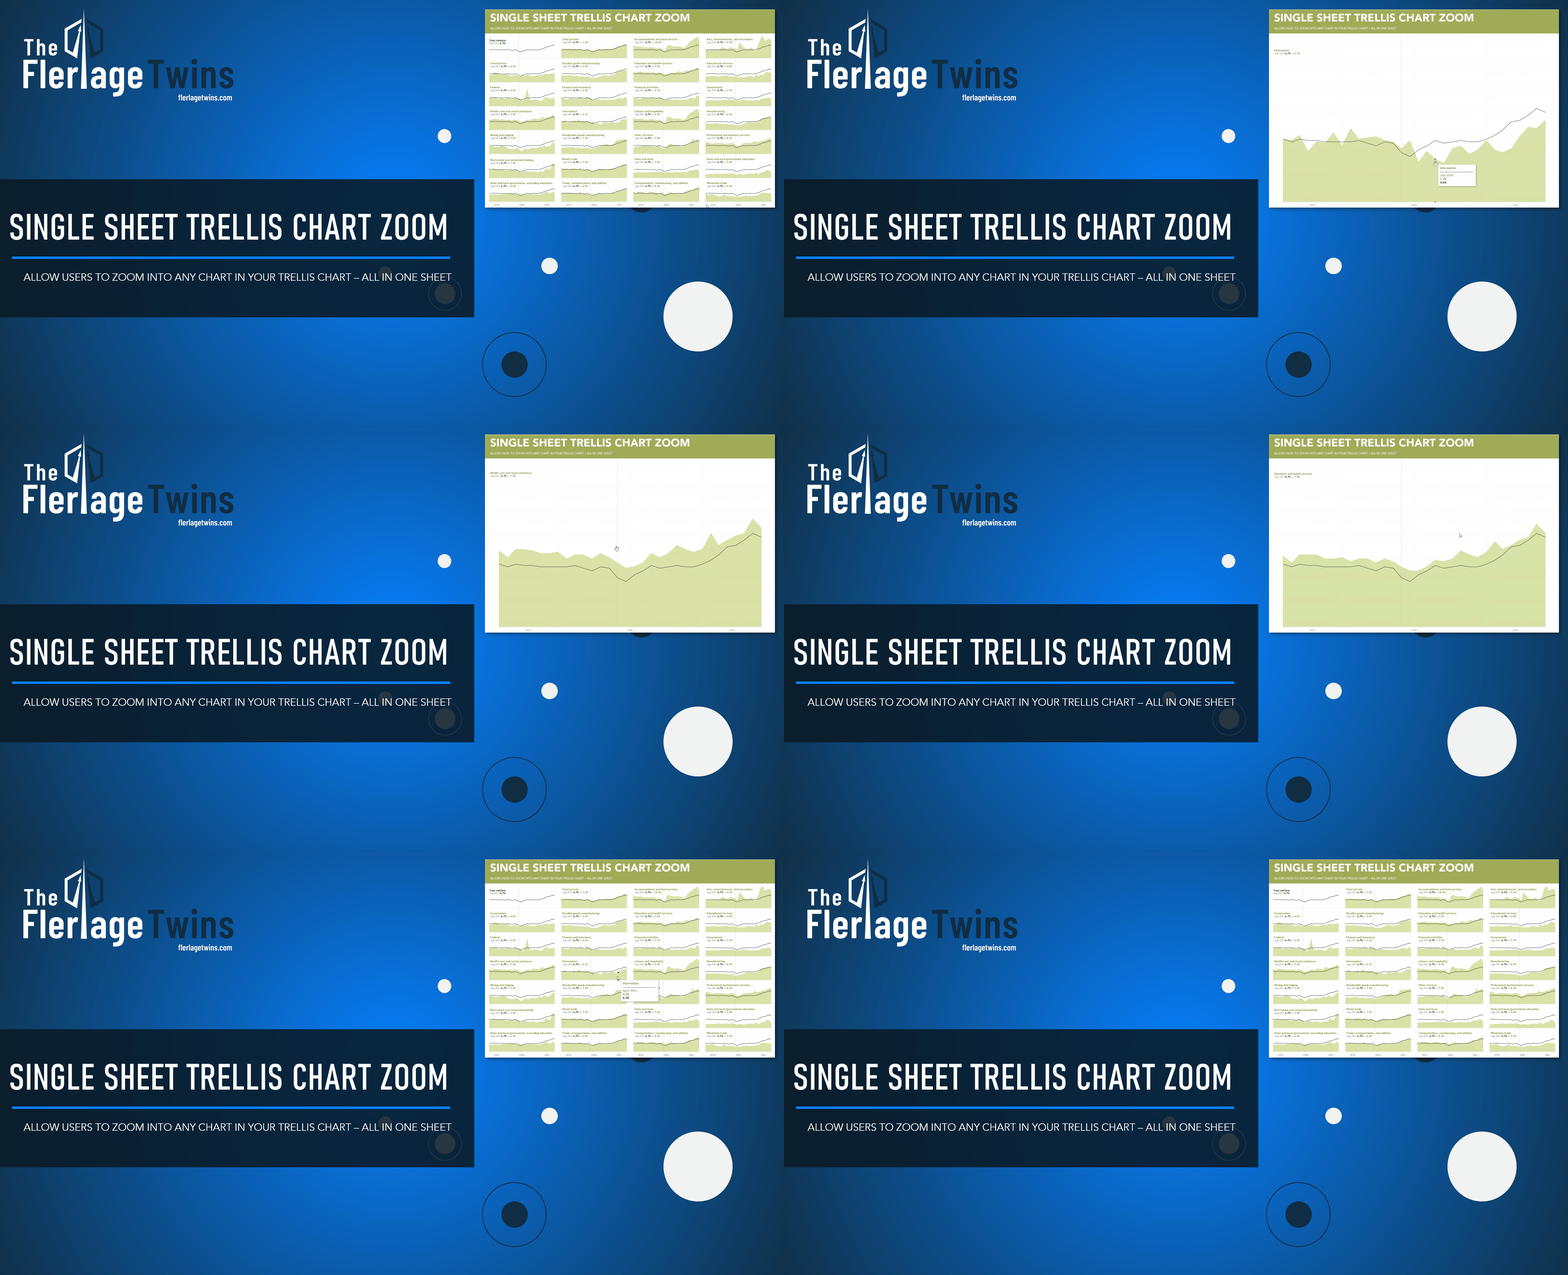
One particular view broke down the job openings rate by industry via a small multiples chart. There were 28 small charts on this single dashboard (this has since been updated to group up some of the industries). Since they were quite small, I wanted to allow my users to zoom into any single on of them and explore it further. The result was a cool little way to zoom into any single chart then zoom out - ALL IN A SINGLE SHEET! The end result looked like this:

If you're curious on how to do this in a single sheet, check out the video. And check out the workbook on Tableau Public and specifically the breakdown by industry dashboard to see this in action.


Nice trick! Thank you for sharing.
ReplyDeleteHow did you create the text label on top left corner of each chart?
Try this article: http://vizdiff.blogspot.com/2022/02/labeling-trellis-chart-via.html
Deletehow can we download the workbook to see more detail on the build?
ReplyDeleteUnfortunately, it's not downloadable. Can you message me (flerlagek@gmail.com) and I can send you something. Thanks.
Delete