More Than One Way to Skin a Cat...in Tableau (Part 1)
Disclaimer: this is part 1 of a two-part series. You can check out part 2 here. No cats (or any other animal) were harmed in the development of this blog post. Please note that some of these GIFs may appear small on screen. They are, however, recorded in a higher resolution. For a closer look, you should be able to simply zoom into your web browser or right-click and open in a new tab (which will show it as it was recorded).
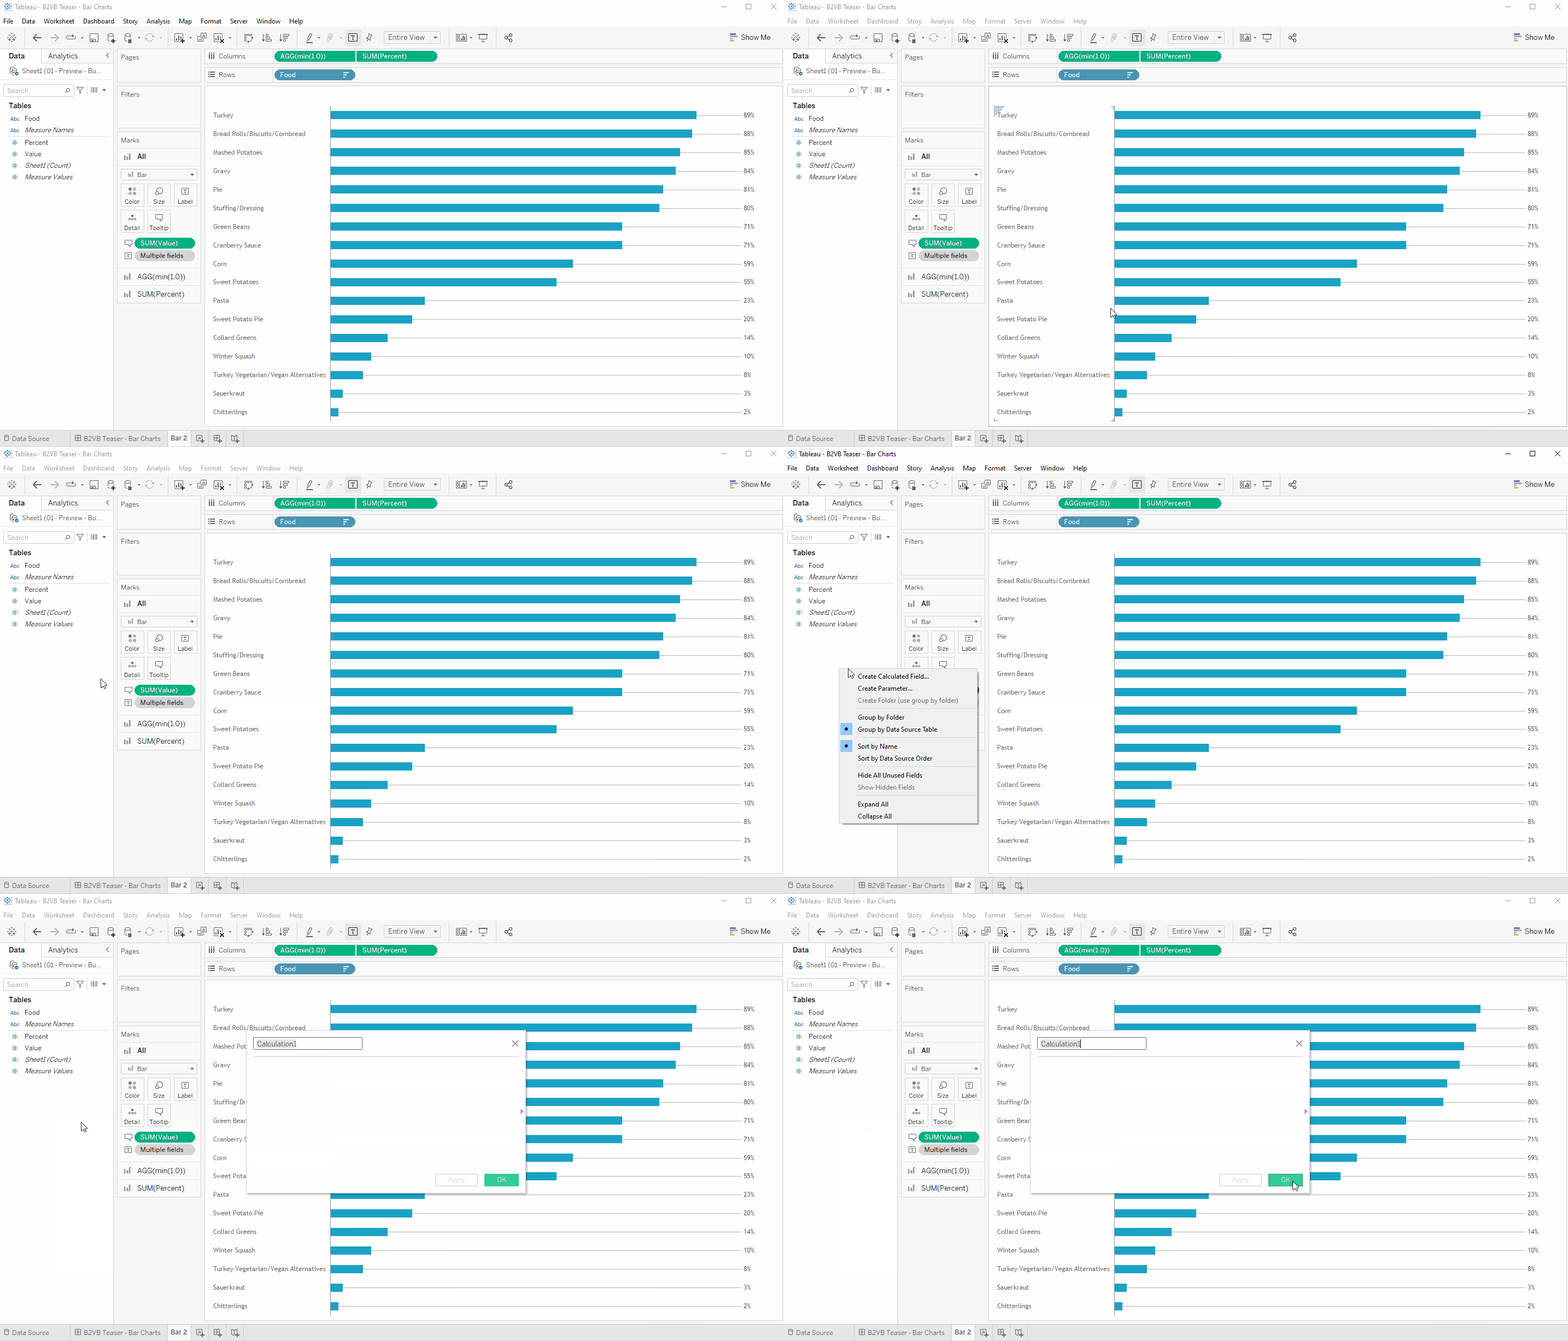
When I first started using Tableau, I learned to create a calculation by right-clicking in the white space in the side panel and choosing, "Create Calculated Field":

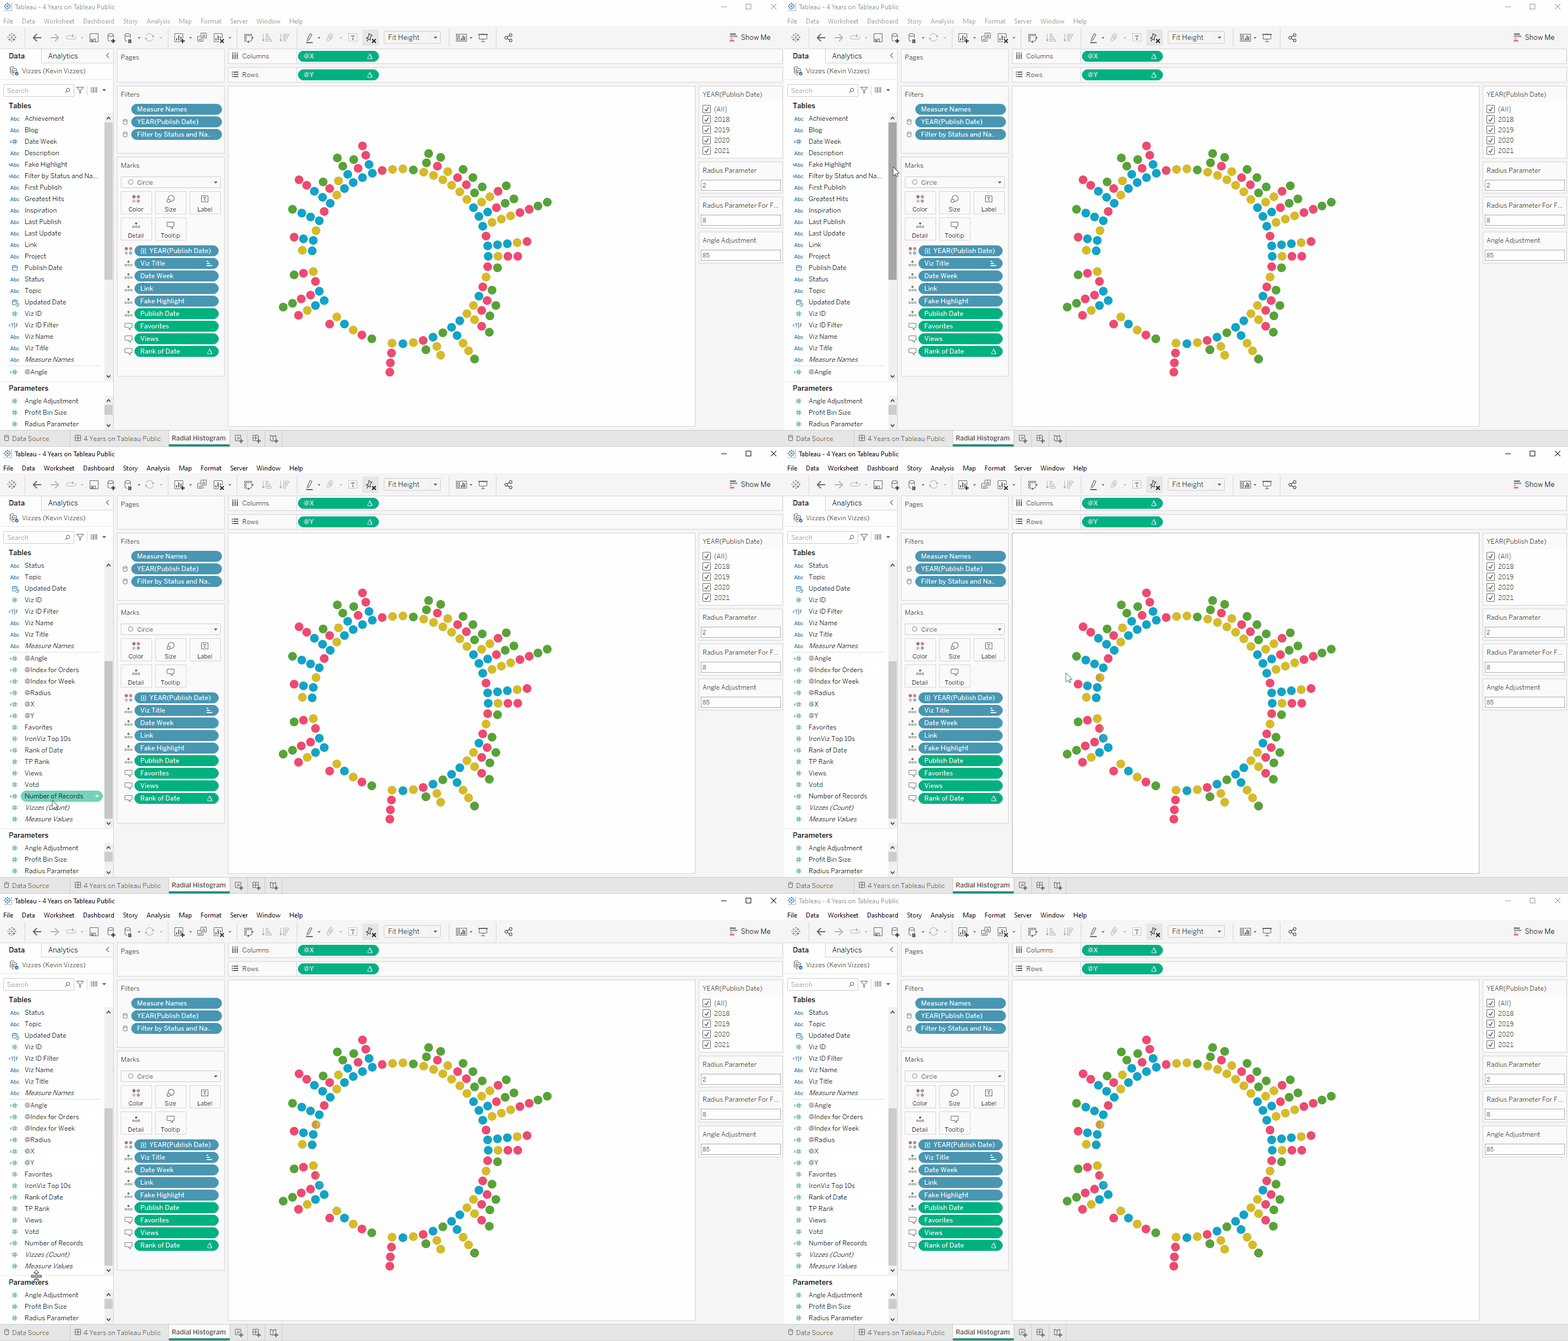
It wasn't until about 8 months into using Tableau that I ran into a situation where there was no white space!!!! How the heck do I create a calculation now?????

Without that white space, I had no idea how to create a calculation. I was far too embarrassed to ask any of my colleagues or brother, so 8 months into using Tableau, I found myself Googling "how do I create a calculation in Tableau". Wow!
The idea of this blog post is to simply show users different ways of performing a single function (such as creating a calculation). Knowing the different ways can come in super handy in so many situations (the one I just described for example). I'm not going to talk about shortcuts like CTRL S for saving or other things like that. I'm also not intending for this to be all inclusive in any way. I'm simply trying to call out a variety of functions that can be performed in a variety of ways. Each function has been placed into a loose group just to keep it better organized. Note: I welcome feedback as I'm 100% certain that I've missed plenty of things. I'd love to see your ways! Just share on Twitter or LinkedIn!
Okay, how will this work? Well, I'll simply show the type of function, provide a numbered list of ways to perform this function, and the gif will show you how to do each and will correspond to the numbered list. Again, this is Part 1 of a two part series. You can check out part 2 here.
CALCULATIONS & PARAMETERS
Create a Calculated Field
1) Right-click in the side bar white space and choose Create Calculated Field
2) In the side bar, click the caret next to the search box and choose Create Calculated Field
3) Go to the Analysis menu and choose Create Calculated Field
4) If you want to use an existing field in a calculated field, right-click on the field, choose Create and select Calculated Field
5) On columns, rows, marks card, etc. just double click and type the calculation. If you want to save it as a field, then you can open a calculated field window and drag that pill into it.

Edit a Calculated Field
1) Right-click on the field in the side bar and choose Edit
2) Go to the Analysis menu, choose Edit Calculated Field and select the field you want to edit

Create a Parameter
1) Right-click in the side bar white space and choose Create Parameter
2) In the side bar, click the caret next to the search box and choose Create Parameter
3) If you want to populate your parameter with values from a specific field, right-click on the field, choose Create and select Parameter

Show a Parameter
1) Right click on the parameter in the side bar and choose Show Parameter
2) On a sheet or a dashboard, go to the Analysis menu, choose Parameters and select the parameter that you want to show
3) On a dashboard, select a sheet, click the caret, choose Parameters and select the parameter that you want to show

Edit a Parameter
1) Right click on the parameter in the side bar and choose Edit
2) When the parameter is showing, click the caret in the parameter and choose Edit Parameter

DATA SOURCES
Before we get started on data sources, you should know that if they appear in a drop-down menu, you can select the pane below it and drag it down so that all of them are shown. This will be important for many of the examples below.

Edit Data Source
1) On a sheet, right-click the data source at the top left and choose Edit Data Source
2) Click on the Data Source tab at the bottom left and use the caret at the top to choose your data source
3) On a sheet or dashboard, go to the Data menu, choose your data source, then select Edit Data Source
Note that the same steps will allow you to rename a data source, edit data source filters, etc.

Publish a Data Source
1) On a sheet, right-click on a data source at the top left and choose Publish to Server
2) On a sheet or dashboard, go to the Server menu, choose Publish Data Source, and choose the data source you want to publish
3) On a sheet or dashboard, go to the Data menu, choose your data source, and select Publish to Server

Export Data to CSV of XLS
1) While on a sheet, in the side bar, click on the little lines to the right of the search box and choose Export All, then save it somewhere to your computer
2) While on a sheet or dashboard, go to the Data menu, choose your data source, then select Export Data to CSV
3) While on a sheet or dashboard, go to the Worksheet menu, choose Export, then select Crosstab to Excel

Create Local Data Source from Published Data Source
If you've published a data source and need to edit that data source, you will need to first create a local copy of that data source. The below shows two ways of doing this, one of which is, by far, my preferred method.
1) Go to the Data Source tab at the bottom left and click the down arrow to download your data source (note that it will be selected by you may have to scroll to find it - I think it can be quite confusing to do it this way)
2) On a sheet, right-click the data source at the top left and choose Create Local Copy (in my opinion, this is the only way to do it...much faster and less confusing)

Refresh Extract
1) On a sheet, right-click the data source, choose Extract, and select Refresh
2) On a sheet or dashboard, go to the Data menu, choose your data source, select Extract, then select Refresh
3) On a sheet or a dashboard, go to the Data menu and choose Refresh All Extracts, then click the Refresh button (this, of course, will refresh all of your extracts at one time)
4) Go to the Data Source tab at the bottom left and click Refresh at the top right.

Create an Extract
1) On a sheet, right-click the data source, choose Extract Data
2) On a sheet or dashboard, go to the Data menu, choose your data source, select Extract Data
3) Go to the Data Source tab at the bottom left and check the Extract radio button at the top right.

Create a Data Source Filter
1) On a sheet, right-click the data source, choose Edit Data Source Filters
2) On a sheet or dashboard, go to the Data menu, choose your data source, and select Edit Data Source Filters
3) Go to the Data Source tab at the bottom left and click Add under Filters at the top right.

View All Data
1) While on a sheet, in the side bar, click on the little lines to the right of the search box
2) While on a sheet or dashboard, go to the Data menu, choose your data source, then select View Data

FORMATTING
General Formatting
1) Most formatting options can be accessed by simply right-clicking on the canvas and choosing Format
2) The same options can be accessed using the Format menu and choosing the option (such as shading)

Copy & Paste Formatting from One Sheet to Another
1) On the sheet that you want to copy the formatting, go to the Format menu and choose Copy Formatting; then on the sheet you want to paste the formatting, go to the Format menu and choose Paste Formatting
2) Right click the tab at the bottom of the sheet that you want to copy formatting and choose Copy Formatting, then right-click on the sheet you want to paste the formatting and choose Paste Formatting

Format Fonts
1) Fonts can be formatted anywhere within a workbook typically by right-clicking and changing the font
2) You can format all fonts at the same time (with one click) using the Format menu, choosing Workbook, and then change the fonts

Filters, Legends, and Highlighters
Show Filters, Legends, and Highlighters
1) On a dashboard, click on a sheet, click the caret and choose Filters, Legends, or Highlighters then choose the one you want to show
2) On a dashboard or a worksheet, go to the Analysis menu and choose Filters, Legends, or Highlighters then choose the one you want to show
Note: there are other ways to show filters - see next section.

Add Filters to a Worksheet
1) Drag a field to the filters shelf
2) Right-click on a field and choose Show Filter (this will add it to the filter shelf and show the filter)
3) Go to the Analysis menu, choose Filters then choose the field (which must be in your view) to filter on (this will add it to the filter shelf and show the filter)
4) Right-click on dimension in your view and choose Exclude to create a filter on that dimension that excludes the selected values
5) Right-click on dimension in your view and choose Keep Only to create a filter on that dimension that only shows the selected values

Okay, that's it for Part 1 of the series. Check back soon for Part 2.
Thanks for reading!


No comments: