A Starter Kit for Text Analysis in Tableau
I was recently asked to visualize some survey results. I’m always excited to start a new project like this, so I eagerly jumped into the data. Unfortunately, I immediately found that almost every question was open-ended. There were virtually no multiple choice or numeric-answer questions at all. Thus, analyzing this data would require something a bit more qualitative than quantitative. It was then that I realized that I had absolutely no idea how to visualize this data and would need some help.
Working at a university, I knew there would be someone there who could help me understand how best to visualize this data. So I spoke to the folks in our Digital Scholarship team and they introduced me to an online software package called Voyant Tools. When you connect to the tool, it prompts you to upload your text, then allows you to do some basic analysis of that text.
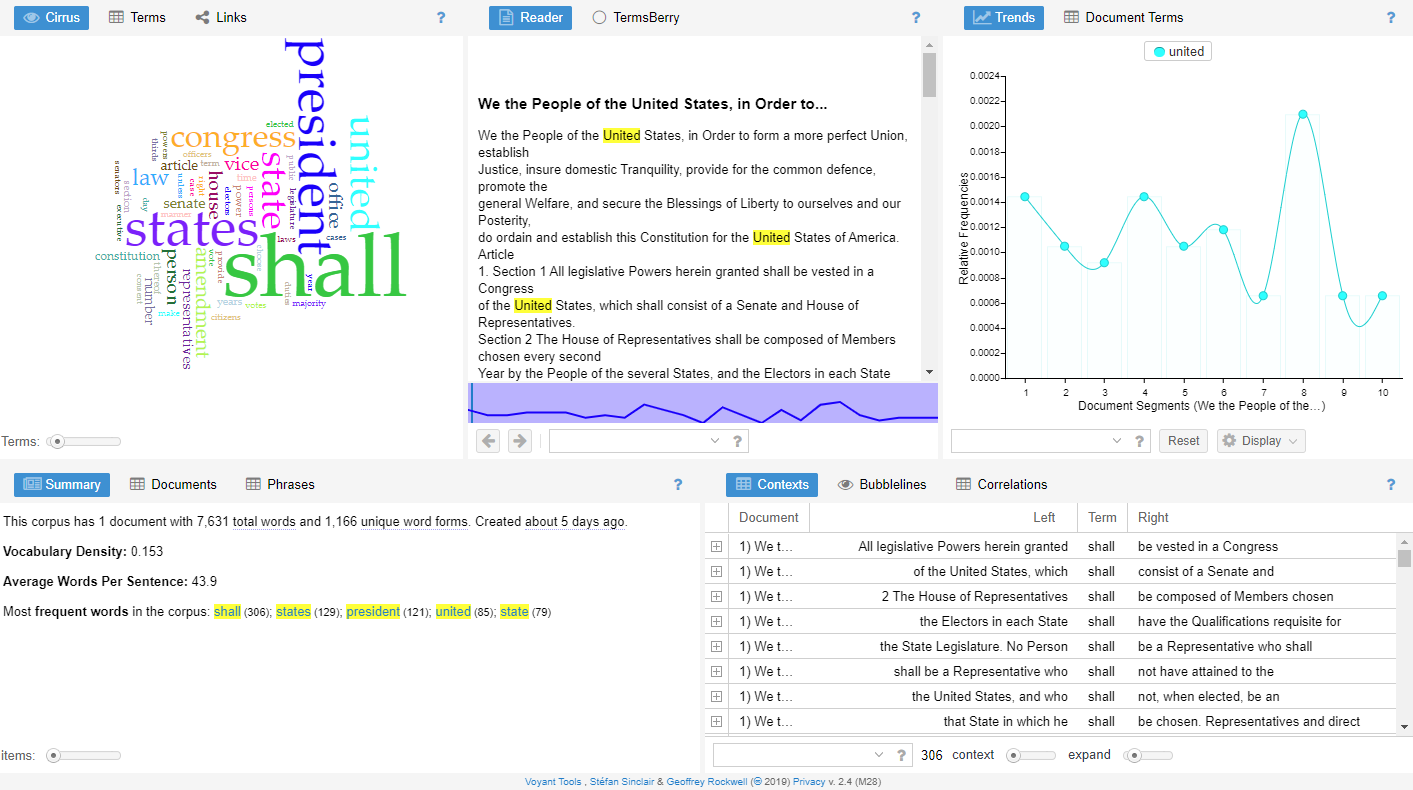
The tool provides a variety of different ways to visualize the textual data, including word clouds, word counters, bubble charts, and many more. While I thought the tool was quite good, there were a few drawbacks for my specific use case. First, my data was tabular—it had a row for each survey response along with dozens of columns for each individual question. I could not find a way to get Voyant to load such a data file—it simply expected a large chunk of text. Second, the tool did not have the ability to build custom charts. Being accustomed to Tableau, I felt that this was critical. So, I decided to come up with a way to visualize this in Tableau. Thus was born what I’m calling my Tableau Text Analysis Starter Kit.
A Forewarning…
Before I dive into the starter kit, I want to say that text analysis is a large and complex field and what I’m sharing here only includes very basic capabilities. Additionally, other than doing a few visualizations that compare word usage (such as Word Usage in Sacred Texts), I’ve done almost no text analysis in my career. So please keep that in mind as you read the rest of this blog. My goal is simply to provide some tools to allow you to get started with text analysis in Tableau, along with some examples of potential charts you can create once you have data in a usable format.
Data Prep
With clean data, there are no limits to what can be created in Tableau, so the biggest challenge of this project is to break these large chunks of text into smaller pieces—pieces that can then be contextualized and, to a degree, analyzed using quantitative methods. I started out by considering a few different methods for data prep, including more traditional data prep/ETL tools and an online tool by Wheaton College called Lexos, which allows for in-depth cleaning and prep of data. Both of those options proved to have a couple of drawbacks, so I decided that I’d have no choice but to write some code using Python.
Warning: Though I have a background in programming, I’m an amateur with Python, so if you decide to look at my code, please keep that in mind!
So, after working on the code for a couple of weeks, I now have a Python script that does the following:
1) Breaks each text-based field into individual words (a row for each word).
2) Flags stop words—very commonly-used words such as the, a, is, etc.
3) Identifies each word’s stem—a sort of root word that is shared by multiple similar words (for further details, see Word Stems in English).
4) Breaks each text-based field into n-grams—segments of n contiguous words (the number of words, n, can be specified by the user).
5) Performs basic sentiment analysis for each word and each n-gram.
6) Groups words and n-grams into sections so that you can see how words and phrases are used over time.
7) Outputs a file for individual words and a file for n-grams. Each file links back to the original file via a key (so that you can join back to it in Tableau). Additionally, each file assigns a unique sequential identifier to each word/n-gram so that you can order them in your analysis.
The output files will look something like this:

Sample of Word File

Sample of N-Gram File
Note: The code makes heavy use of the Natural Language Tool Kit (NLTK), including SnowballStemmer for word stemming, Vaderfor sentiment analysis, and the NLTK’s list of common stop words.
See the “How To Use” section for details on exactly how to use the code with your own data.
On To Tableau
With the data now in a structure that makes it easier to visualize, we can bring it into Tableau. As the word and n-gram files only contain the text fields that were parsed, I’d recommend that you start by joining them back to your original file. From there, you can fairly easily build your charts. For example, we can, of course, create word clouds (for both individual words and for n-grams). Note: All of the below samples have been generated from the US Constitution.
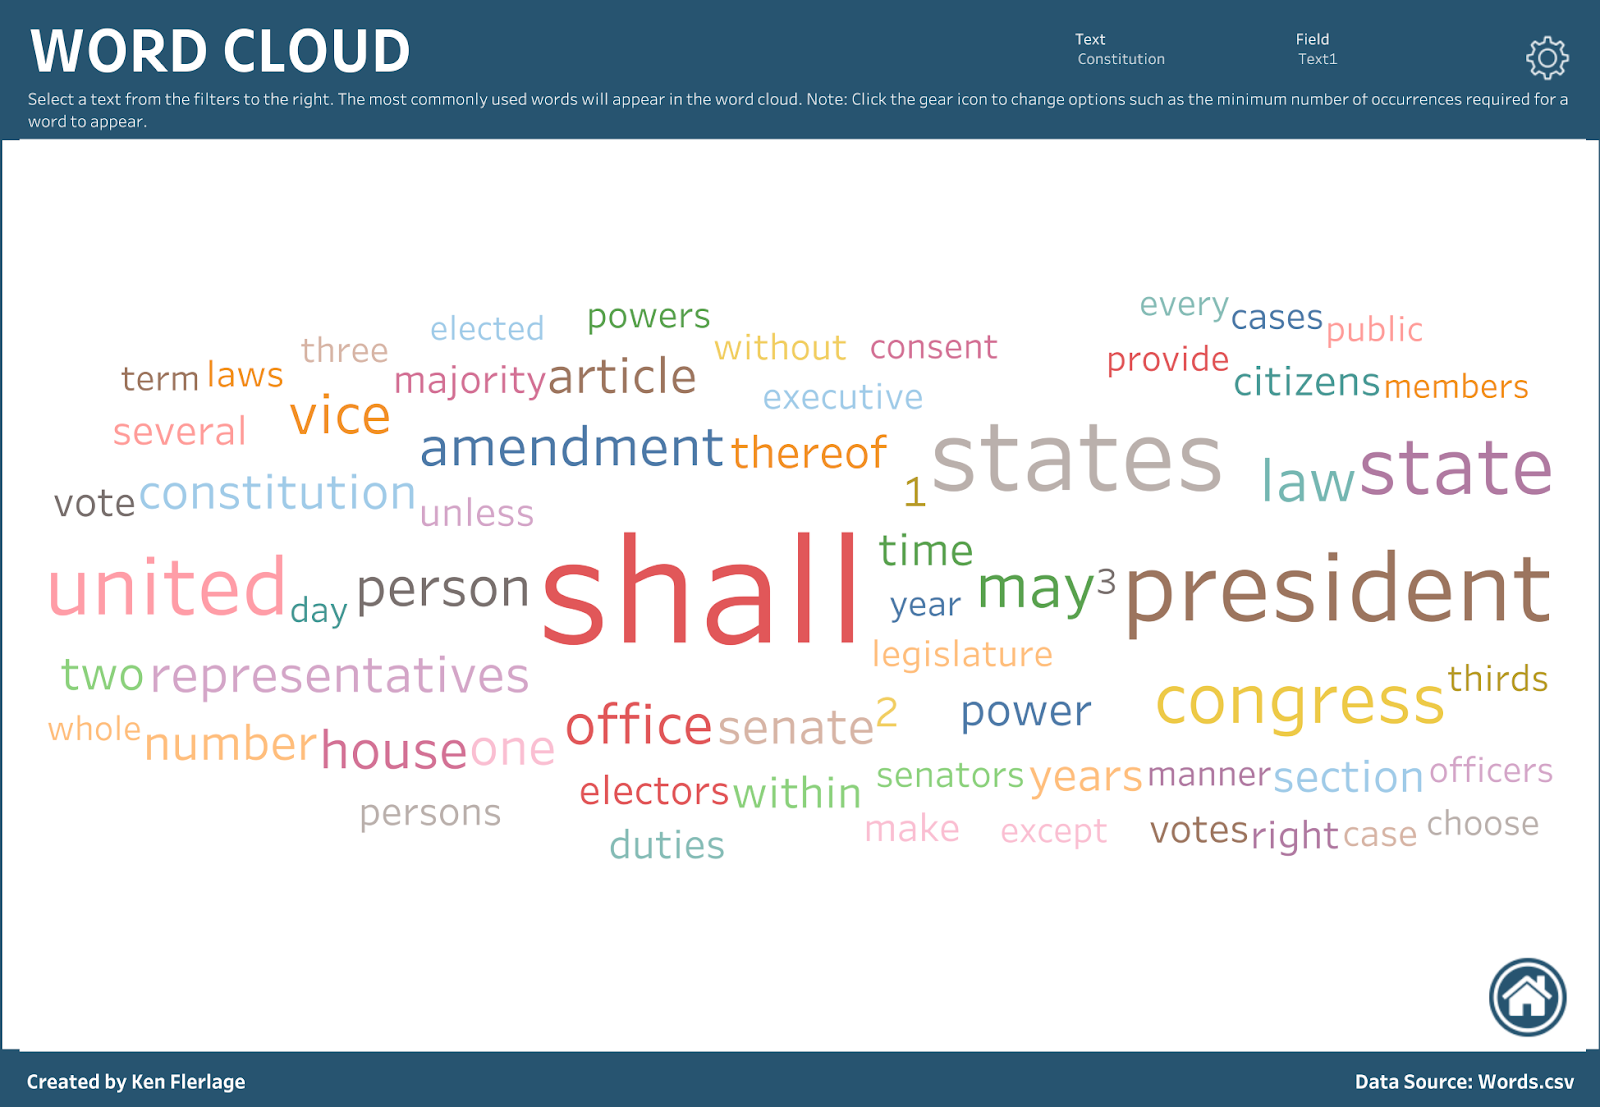

But I’m not a fan of word clouds as I feel there are usually better ways to visualize such data. So, instead of word clouds, let’s just use a simple sorted bar chart. The following allows you to click on a word, then highlights that word with the text so that you can see where it’s used.
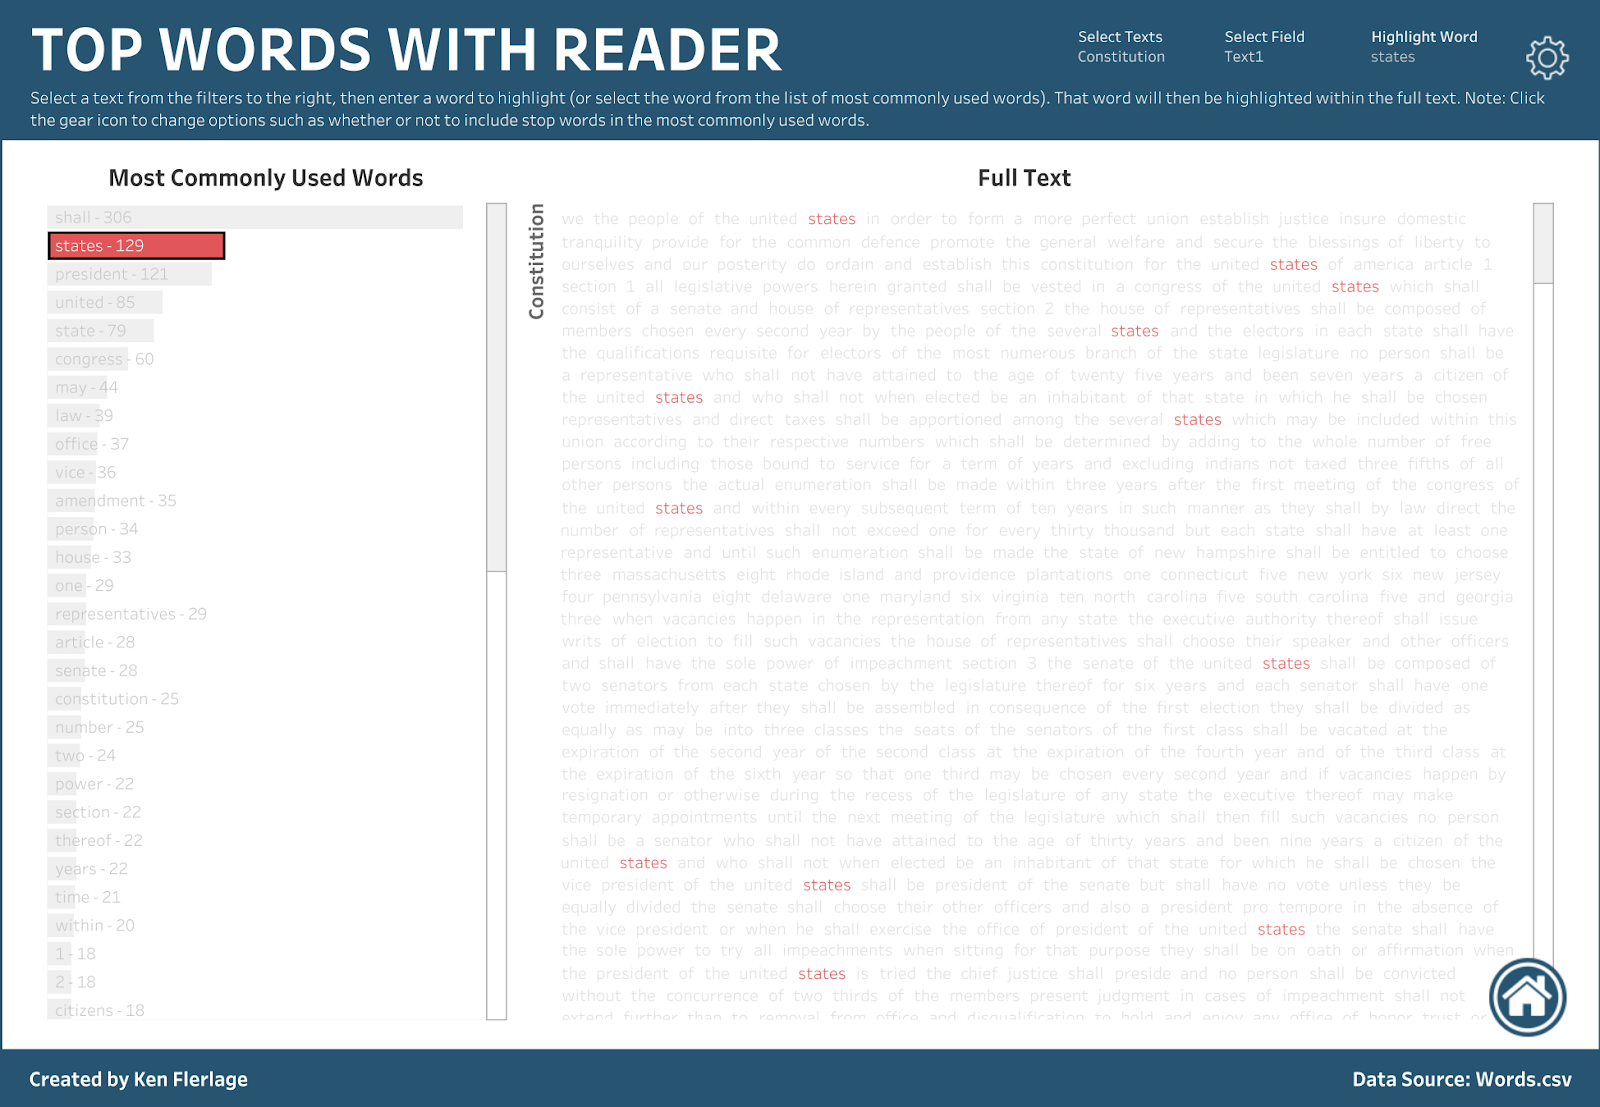
And there are lots of other charts that can be created such as a bubble line chart, which I’ve based on a similar chart in Voyant, a barcode chart, line charts showing usage over time, etc. All of these can be easily created with the word and n-gram data from the Python program, with no extra data prep.
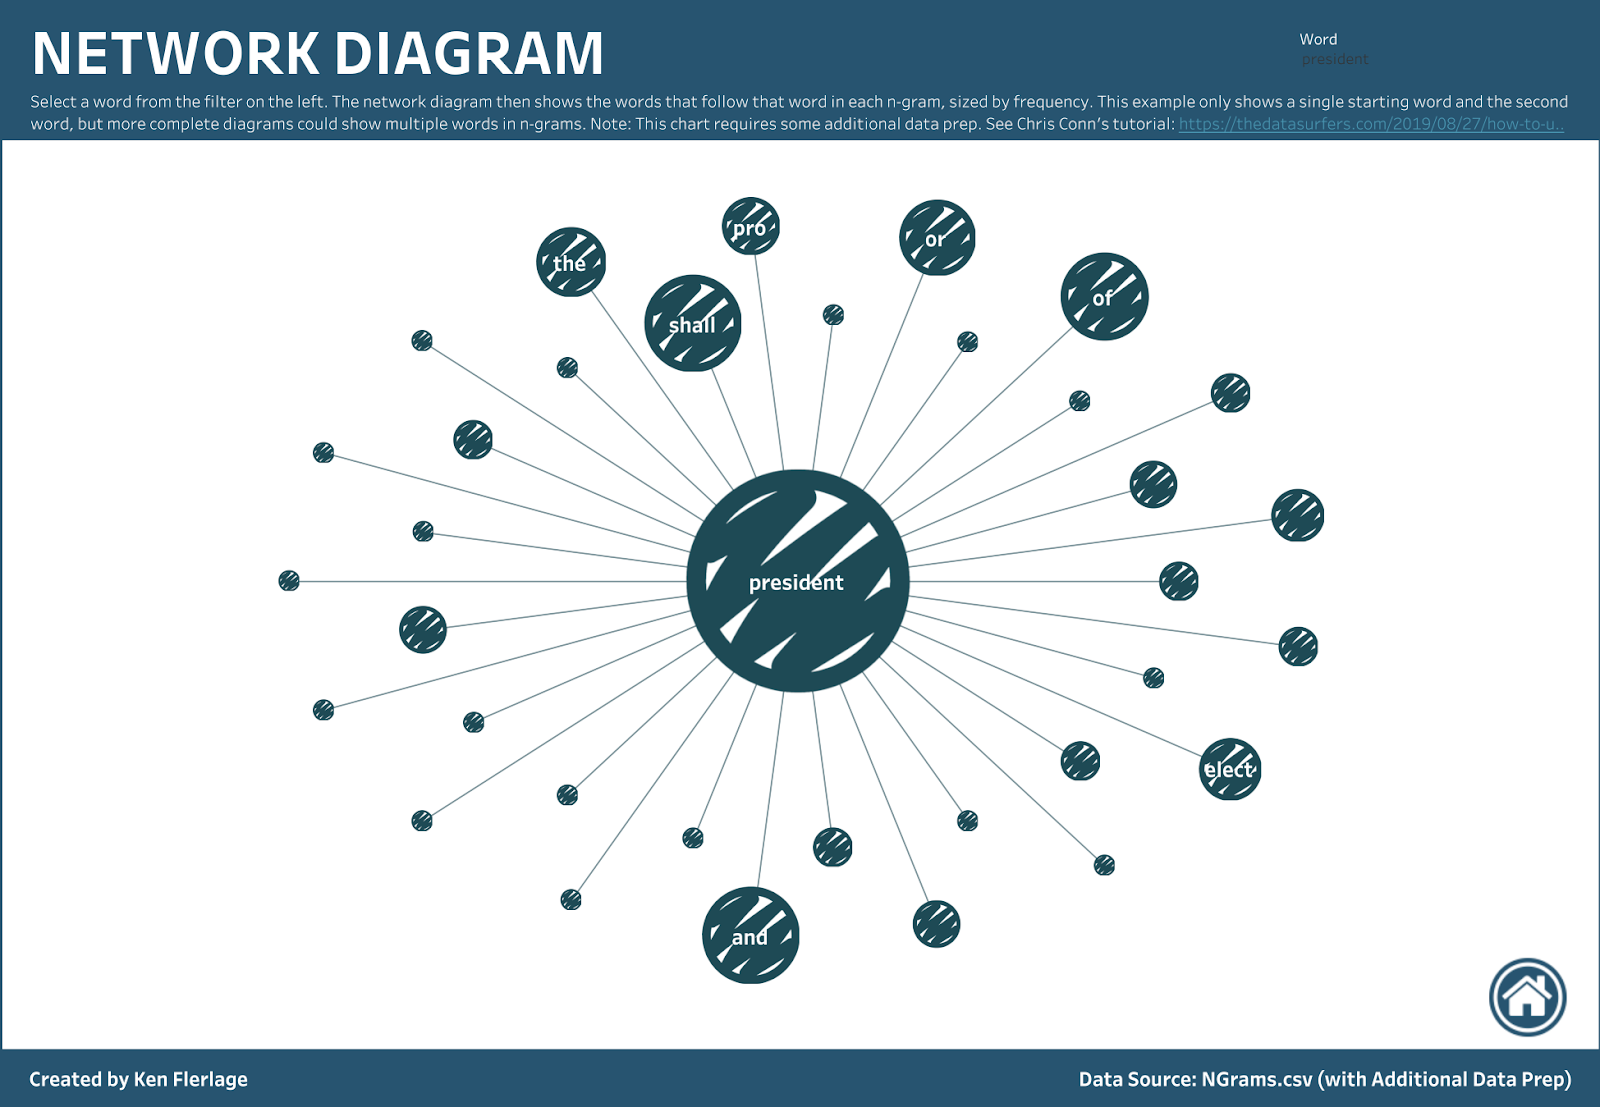
If you take some time to do a bit of additional data prep, you can create somewhat more advanced charts. For instance, you could create a tree diagram.
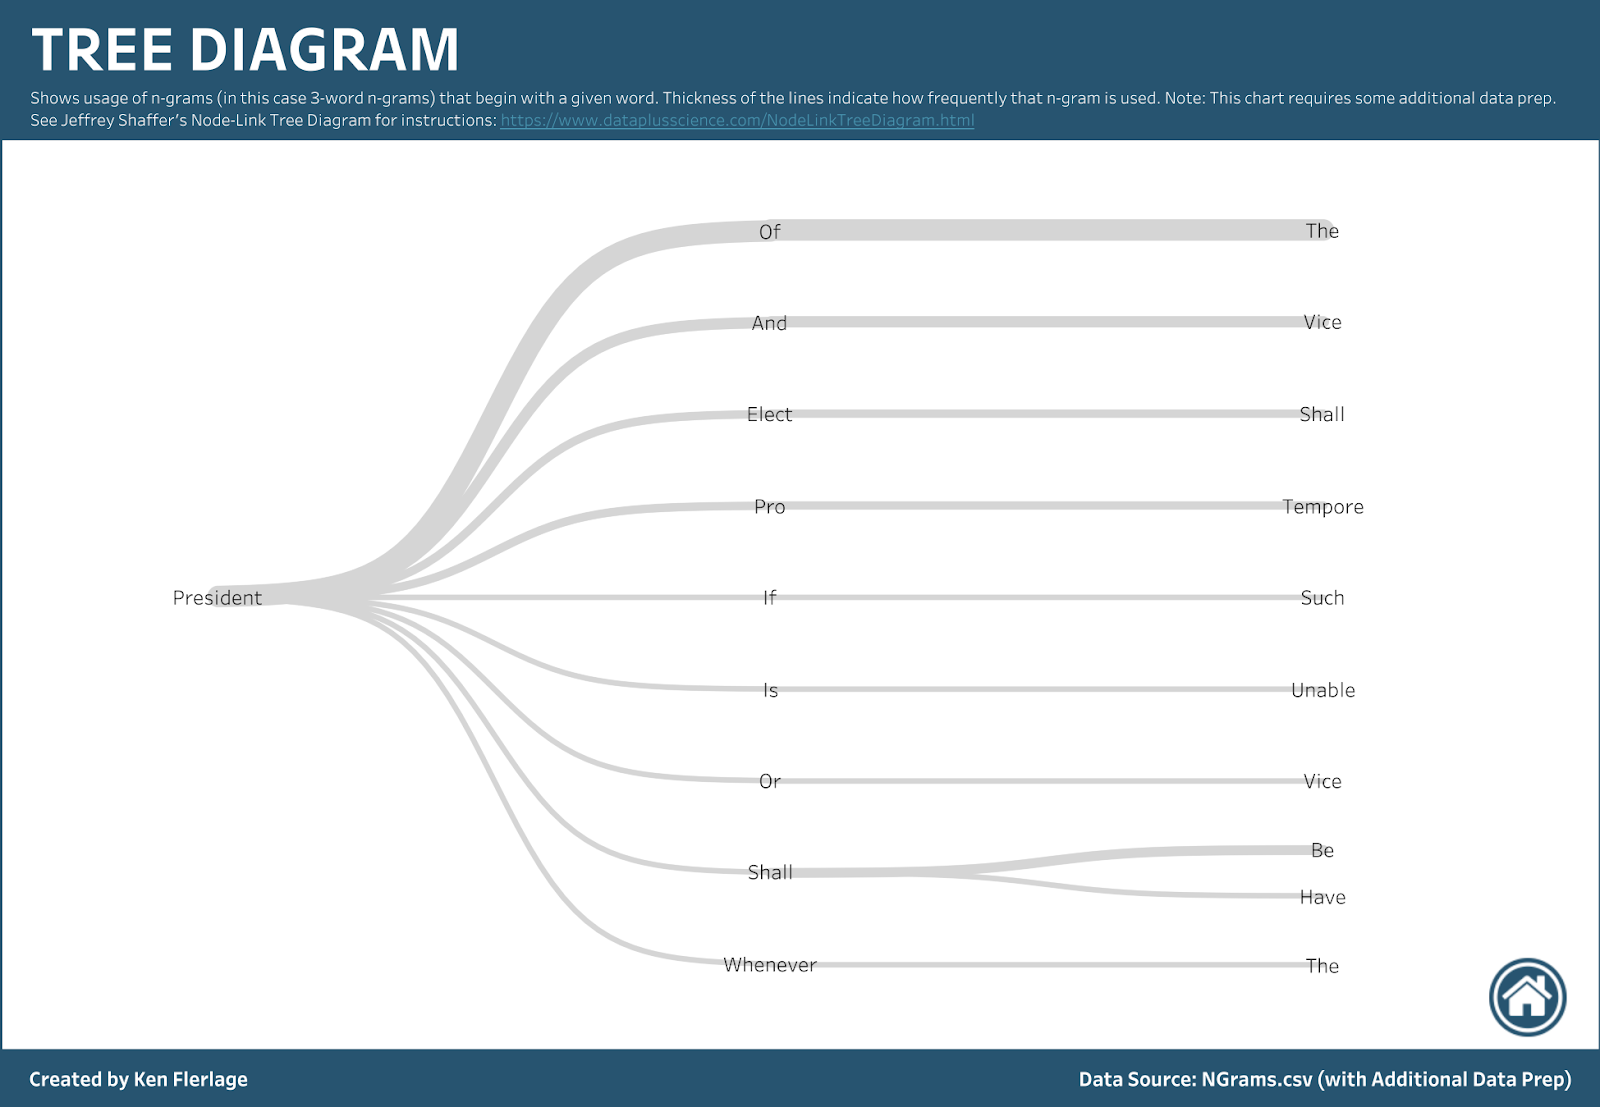
Or you could create a network diagram.
Or you could even create a sort of “circular link diagram” that shows word connections throughout the text.

Note: For details on how to create a tree diagram, see Jeff Shaffer’s blog, Node-LinkTree Diagram in Tableau; for details on how to create a network diagram, I recommend Chris Conn’s How to use Gephi to create Network Visualizations for Tableau.
In order to make these different charts easily accessible, I’ve compiled them into a single Tableau Public workbook, which you can download and use as desired.
How To Use
OK, here’s how to use the Python program. For starters, you need to create an input file in CSV format. This file needs to have one field called Record ID which contains a unique numeric ID. This will allow us to index the output files so you can easily join it back to the original file. The file must also include one or more text-based fields. The file can, of course, contain any other fields you desire—the program will simply ignore them.
To help you better understand the format, I've included the sample file I used in this blog. It contains two records, one for the Constitution and one for the Declaration of Independence. You can find the file here: Sample Input File
Note: As you might notice in the comments, some people have had problems with the code not seeing the Record ID field. While I am not 100% certain what's causing this, it seems to be a problem only when Record ID is the first field in the file. As a workaround, try inserting a field in front of it. It's best to just insert a bogus field that will not need to be parsed.
Once you have your input file ready to go, you’ll need to run the Python code. You have two options here. First, if you’re comfortable downloading the code and running it yourself, you can find the code on my Github account: Text.py. If you’re not comfortable with this, then I’ve compiled the code into an executable package which should run on pretty much any platform. Download the package, Text Analysis Package, onto your computer (Note: because the NLTK package is very big, this executable package is quite large as well—over 1 GB—so be patient while downloading). Once you’ve downloaded the package, unzip it to a location on your computer, then run the Text.exe program from within the dist folder.
When you run the program, it will show a simple GUI for collecting inputs.

It isn’t the prettiest GUI, but it works! You’ll now need to update each of the inputs as described on screen. Once you’ve updated the fields, click Submit. For files with limited text, the program should complete quickly; larger texts might take a bit longer. But, when it’s done, it will output two files to the same location as your input file, called Words.csv and NGrams.csv.
Finally, you can download my Tableau workbook, update the data sources to use these files, and starting building!
Before I wrap up, I just want to point you to a couple of recent examples that that use some of these text analysis techniques. The first, by Robert Rouse, analyzes the text of The Acts of the Apostles. This is a truly amazing piece of work, so I highly recommend that you take a look. My second example, by Elijah Meeks, analyzes responses from the 2019 Data Visualization Community Survey. While this was not created in Tableau, it is an excellent example of how we can use these techniques with open-ended survey questions. In fact, his use of tree diagrams is what inspired me to include them in this starter kit.
A Couple of Examples
Thanks for reading! If you have any thoughts or questions, please let me know in the comments section.
Note: As you'll see in the comments, there have been a number of people who've had trouble running the GUI. If you have this problem, please contact me--most of the time, it has a reasonable explanation, so I'm happy to work through the problem with you. One thing to be aware of: If you start with a file in Excel format then save as CSV, Excel will sometimes leave an invisible character in front of the Record ID field name. In this scenario, the Python program will be unable to find the Record ID field and will simply end. If you find this happening, there are two potential solutions. First, you can use a text editor to open the file and try to remove the bad character (this may require turning on special characters). Second, you can put the Record ID as the second column in your spreadsheet, then re-save as CSV. If you run into any other issues and need help, please don't hesitate to reach out to me.
Note: As you'll see in the comments, there have been a number of people who've had trouble running the GUI. If you have this problem, please contact me--most of the time, it has a reasonable explanation, so I'm happy to work through the problem with you. One thing to be aware of: If you start with a file in Excel format then save as CSV, Excel will sometimes leave an invisible character in front of the Record ID field name. In this scenario, the Python program will be unable to find the Record ID field and will simply end. If you find this happening, there are two potential solutions. First, you can use a text editor to open the file and try to remove the bad character (this may require turning on special characters). Second, you can put the Record ID as the second column in your spreadsheet, then re-save as CSV. If you run into any other issues and need help, please don't hesitate to reach out to me.
Ken Flerlage, September 28, 2019


Hi Ken,
ReplyDeleteThanks for posting this! I'm getting KeyError: 'Record ID' when I run the Python program. One of my fields is called "Record ID"...any clue why this is happening?
Thanks!
I saw this the other day as well. For some reason, Python seems to see some extraneous characters in the first field name. Can you try moving Record ID to be the second column in your data file? If that doesn't work, please email me...flerlagekr@gmail.com
DeleteOn line 101, change the character encoding from utf-8 to utf-8-sig.
DeleteAwesome guide! I'm having some problems running the exe and was wondering if you had any quick tips. Anaconda installed, yet the exe does nothing upon clicking. The code also hangs when i give an input file, turns to not responding on a small dataset. Any ideas anyone?
ReplyDeleteThanks for the feedback. I'd like to figure out what's going on here so I can correct the problem. Any chance you could send me an email? flerlagekr@gmail.com
DeleteI am also seeing "Not responding" issue on my small csv file. Did you find the solution?
DeleteCan you email me at flerlagekr@gmail.com?
DeleteAnyone have luck addressing the above? Experiencing the same issue re: .exe and .py file doing nothing when executed via python desktop app or command prompt. thanks in advance,
ReplyDeleteI really want to address this problem so I can make sure others do not receive it. Can you email me at flerlagekr@gmail.com?
DeleteHi Ken, great post - thanks for your work on this. I am trying to run the GUI as well as Python script through Anaconda, getting nothing as above. Did you get to the bottom of the problem? Am I missing something? Thanks
DeleteThere have been a variety of causes. Would you be able to send me an email? flerlagekr@gmail.com
DeleteJust went through your blog on Word cloud...started downloading your python package...hopefully it should work with the large data set i have..will keep you posted in case of any issues...
ReplyDeleteOne question i have is: Is there no other way to directly work it through tableau without running python or some other coding script?
Not that I can think of. I try to do everything in Tableau Prep or Tableau Desktop as my programming skills aren't what they used to be, but this was a situation where I needed something more.
DeleteVery interesting post Ken, great job. One of the problems I found using your GUI is that the csv file must use comma sepparated columns, but if the text to analyze also have commas, then the record ID error comes out. Two solutions, (1) replace the commas by point or other punctuaction or add double quotes at the begining and end of the text fields.
ReplyDeleteMany programs will fail to properly open such a file, including Tableau and Excel. The best solution would be to use a quoted csv. In other words, values with commas in them should contain double quotes around them.
DeleteKen, I found this link as I am starting in on some initial text analysis and wondering how I could make user of Tableau. Great post - thank you for putting in the hard work to provide this wonderful resource. Excellent job on the Python programming, too!
ReplyDeleteI have been trying over the last couple days to get the program to run successfully. After resolving several minor issues, the final sticking point was an error caused by this line:
csv.field_size_limit(sys.maxsize)
This was causing an error: "OverflowError: Python int too large to convert to C long"
Finding a helpful post on StackOverflow, I changed the line above to this:
csv.field_size_limit(min(sys.maxsize, 2147483646))
And now everything runs just fine! (FYI, I'm running on Win10.) Just wanted to offer this to you and anyone else who might have this issue in the future. Thanks again!
Thanks Eric!
DeleteI had the same issue and this solution solved it! Cheers
DeleteDownloaded your workbook to load up in Tableau... all kinds of errors, and won't load. Any idea why? Are the workbooks just linked to a CSV, or do they have some sort of integration with Python? I don't have any experience there, but I was able to get pretty creative and create my words strings using SQL. If the workbooks are just linked to an extracted CSV, seems like they should load. The PC I am on has Tabluea 2018. Do I need to update it maybe?
ReplyDeleteYou shouldn't have to do anything special if your csv is in the right format. Would you be able to contact me via email? flerlagekr@gmail.com
DeleteHey Ken. Just wanted to say thanks for the post and showing your example. Got this to work real well with data from work. Thanks for sharing!
ReplyDeleteGreat. Glad it's working for you!!
DeleteReally like this post/solution. Does it work on mac? I am a little bit in trouble what path put in the input file box in mac
ReplyDeleteGood question. I think it should work. Feel free to email me at flerlagekr@gmail.com if you need any help troubleshooting.
DeleteGot it working, changed a bit of code :)
DeleteGreat!!
DeleteAwesome code-- thank you! I also modified the file path slash from \\ -> / to make it compatible with mac files: wordFilePath = os.path.dirname(inputFile) + "/"
DeleteAwesome. This is a big help. :-)
ReplyDeleteHi, I am having a lot of trouble with the package. I have the correct "Record ID" field (not the first field). I have attempted to change the code as Eric above suggested, and cannot get the program to run. I have a CSV file with a little over 50k rows. Can you please assist? Thanks.
ReplyDeleteCan you email me a sample of the file? flerlagekr@gmail.com
DeleteHey Ken! This is great and I would love to put this into action at my work. However like a few people I am having Python issues. I run the file and it goes into a non-responsive mode and requires task manager to end the process. Any luck in finding the cause?
ReplyDeleteCan you send me a sample file? flerlagekr@gmail.com
DeleteHi Ken,
ReplyDeleteThanks for the great article and for sharing the code. I am not sure if you have assisted anyone that came across the error below. The GUI goes on to "not responding" after the error appears. I am not sure where I am getting it wrong, I used the sample file you provided:
---------------------------------------------------------------------------
SystemExit Traceback (most recent call last)
in
46 # Check to make sure the input file exists:
47 if not(os.path.exists(inputFile)):
---> 48 sys.exit("Input file does not exits. Exiting the program.")
49
50 # Delete any previously written files.
SystemExit: Input file does not exits. Exiting the program.
Any chance you could email me? flerlagekr@gmail.com. Please share a screenshot of the GUI with values input.
DeleteHello Ken, thank you for sharing this beautiful exercise, in my case I am trying to reproduce the example using you csv data, however I don't understand or see the csv that you are using. I downloaded the InputFile and after running the script the process created the words.csv and ngrams.csv files, I think I am missing some connection files, thanks for you help...Hammu
ReplyDeleteCould you email me? flerlagekr@gmail.com
DeleteHi Ken, thank you so much for sharing this really interesting and applicable exercise.
ReplyDeleteI am a beginner at python and am using Jupiter notebook inside of anaconda to try and reproduce your exercise, however, I get the following error: * Error performing wm_overrideredirect while hiding the hidden master root* expected boolean value but got ""
I am able to see the GUI, but the system exists because my file cannot be found. I was wondering if you knew why this is happening and how can I fix it so I am able to run this experiment/project!
Thank you so much!
Did you send me a separate email on this? If not, could you? flerlagekr@gmail.com
DeleteHi Ken,
ReplyDeleteThank you for creating great article and the workbook.
Can you please help ? I am getting the below error
---------------------------------------------------------------------------
OverflowError Traceback (most recent call last)
in
98
99 # Open the input csv file. Loop through each record and process each field (textFields)
--> 100 csv.field_size_limit(sys.maxsize)
101 with open(inputFile, mode='r') as csvFile:
102 csvReader = csv.DictReader(csvFile)
OverflowError: Python int too large to convert to C long
Thanks for the help,
Could you send me an email? flerlagekr@gmail.com
DeleteHi Ken - When trying to point the tableau workbook to the new data files, it seems to prompt for several other input files besides words and ngrams. Can you indicate what the other files inputs are for the workbook?
ReplyDeleteThere are five different data sources. Circos, Tree, and Network are all very specially-structured data sources used to create the more complex charts. N-Grams and Words are the primary data sources used for most of the charts. Happy to provide you with samples of the other files if desired. flerlagekr@gmail.com
DeleteReally amazing, can you maybe tell me how you derived the Circos, Network and Tree data sources because its not a output from the python code? email christoffbrink@gmail.com
ReplyDeleteI came across this post while looking for info on creating word clouds in Tableau, and I think I have a resolution for the column issue mentioned (sometimes the "Record ID" is not recognized when it is the first column.
ReplyDeleteThis issue could be caused by a Byte Order Mark (BOM), a unicode character used to signal the byte order of a text file. In short, the BOM is being interpreted as a character that is prepending the Record ID field.
The fix:
In the Python code, line 101:
with open(inputFile, mode='r', encoding='utf-8') as csvFile:
Change this to:
with open(inputFile, mode='r', encoding='utf-8-sig') as csvFile:
Changing the encoding will remove the BOM.
Note: I too am not primarily a Python developer and simply dabble.
Brilliant! Thank you!!!
DeleteThis comment has been removed by a blog administrator.
ReplyDeleteThis comment has been removed by a blog administrator.
ReplyDelete